
United States Oil Fund Overview
The United States Oil Fund (USO) is an ETF that tracks the daily price movements of West Texas Intermediate (WTI) crude oil futures contracts. It provides retail traders with direct exposure to the oil market without needing futures accounts, making it a go-to for energy sector bets amid global supply dynamics and geopolitical tensions.
In March 2026, traders monitor USO closely as OPEC+ decisions, U.S. inventory reports, and potential Middle East escalations influence crude prices. This article dissects the short-term trend, pivotal support and resistance zones, RSI/MACD signals, volume patterns, and a balanced outlook to equip traders with educational insights.
Current Price Trend in March 2026
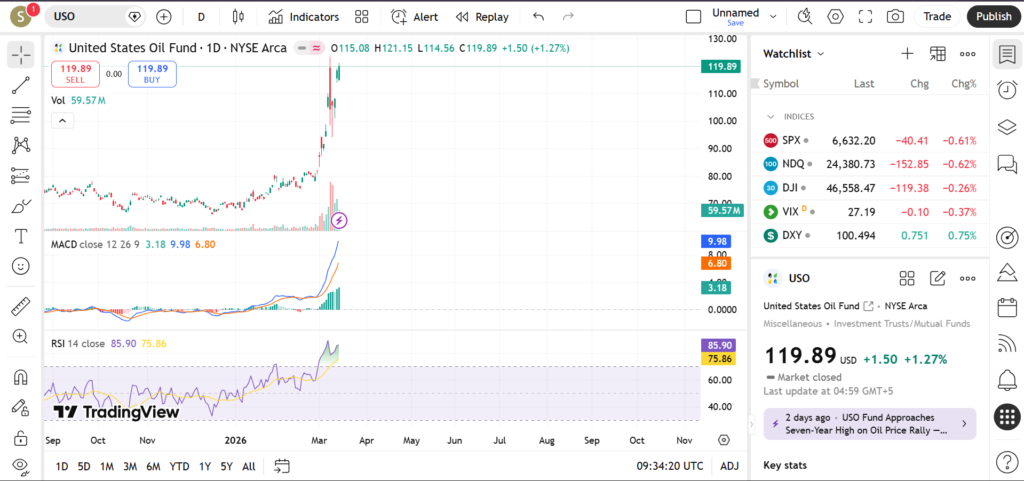
USO displays a range-bound trend in early March 2026, oscillating between recent highs and lows after a strong rally from late 2025 lows. The ETF hovers near its 50-day moving average around $79.89, with the 20-day MA providing short-term resistance overhead and the 200-day MA at approximately $74.67 acting as firm support below.
Recent price action includes a bounce from February swing lows followed by a test of upper range limits, reflecting indecision between buyers and sellers. Major swings align with weekly oil inventory data releases, educating traders on how moving averages filter noise—price holding above the 50-day suggests potential for range expansion higher, while a dip below could signal renewed weakness.
This consolidation phase builds on elevated volumes from prior breakouts, but fading momentum on rallies warns of possible downside tests. Retail traders learn from this setup that range trading thrives on defined boundaries, with breakouts confirmed by MA crossovers or volume surges.
Key Support and Resistance Levels
Support levels serve as potential buying opportunities during pullbacks, often coinciding with historical pivots.
- Near recent swing lows around the 200-day moving average ($74.67)—a critical long-term floor tested during 2025 corrections, drawing institutional interest.
- Around the 50-day moving average ($79.89)—dynamic support where March pullbacks have stabilized, reinforced by round numbers.
- Previous gap fill from early March—a technical void that frequently acts as a magnet for price retracements.
- February consolidation lows—a high-volume zone signaling accumulation if retested.
Resistance levels cap upside rallies until decisively broken, typically at prior peaks.
- Close to the 20-day moving average—short-term overhead barrier on intraday bounces.
- Recent swing high near the year-to-date peak (approaching $124.07)—psychological resistance with profit-taking history.
- Upper range boundary from mid-February—a level where sellers emerged amid supply glut fears.
- Round numbers above current trading near $120—attractive targets for shorts covering positions.
A sustained break above key resistances might signal bullish continuation toward year highs, prompting traders to consider long setups with stops below supports. Conversely, a close below major supports could indicate bearish acceleration, encouraging caution or short-side strategies as oil demand worries intensify.
Indicators – RSI, MACD, Volume
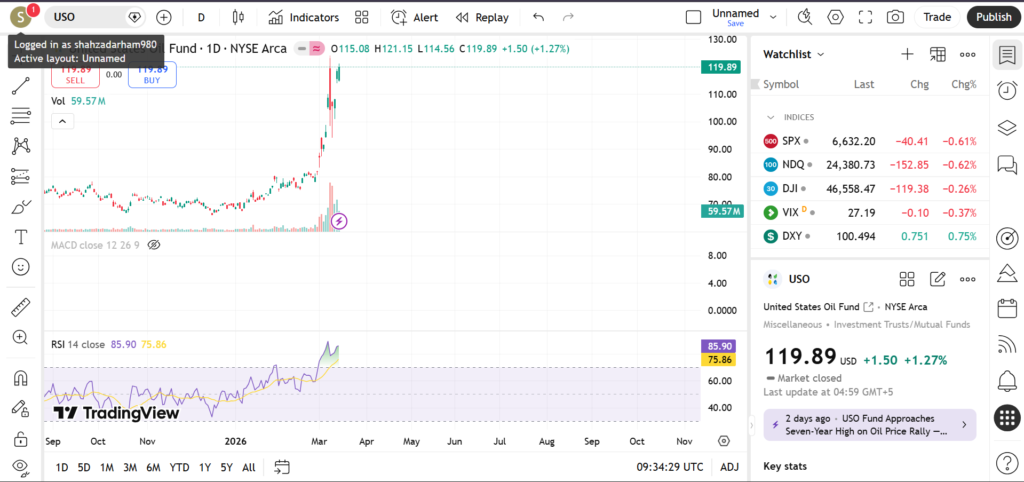
The Relative Strength Index (RSI) for USO registers neutral readings around 50-55 in March 2026, avoiding overbought or oversold extremes and indicating balanced momentum with room for directional moves.
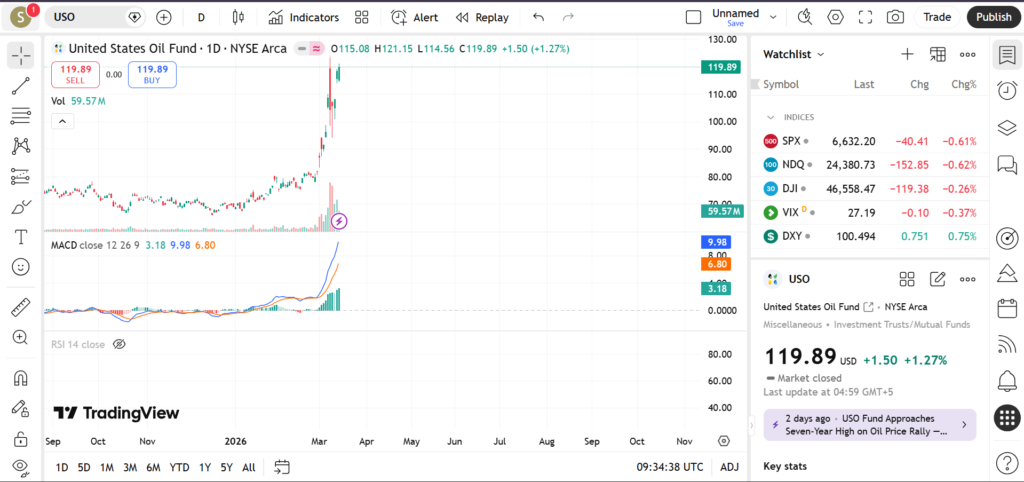
MACD reveals a flattening histogram with the line hovering near the signal, suggesting waning momentum after recent swings—traders watch for bullish crossovers above zero or bearish dives below for confirmation of trend shifts.
Volume patterns show spikes during range tests, particularly on downside probes, while rallies occur on average participation—rising volume on breaks would validate new trends, but declining volume on pullbacks hints at underlying support.
Short-Term Outlook for USO in March 2026
Overall, USO’s technical setup points to continued range trading in March 2026, with price respecting moving averages and neutral indicators amid steady oil fundamentals. Supportive volume on lows bolsters the case for bounces, though macro catalysts could trigger breakouts.
- Traders watch EIA inventory reports weekly for volatility spikes.
- Hold above 50-day MA ($79.89) for range stability or upside bias.
- Geopolitical flares in oil-producing regions as breakout triggers.
- Correlation with broader energy ETFs like XLE for confirmation.
- Upcoming OPEC+ meetings as potential catalysts for supply shifts.
Risks and Important Notes
Oil prices react sharply to unforeseen events like demand shocks, sanctions, or recession signals, potentially invalidating technical levels overnight. Leveraged oil trades amplify risks, so disciplined stop-losses and position sizing remain essential.
This analysis educates on standard tools and patterns—past performance doesn’t guarantee future results, and it’s not personalized financial advice. Consult your risk profile and conduct due diligence.
For deeper dives, explore our technical analysis on energy peers like XLE (Energy Select Sector SPDR) or broader commodity ETFs. Bookmark for updates and trade responsibly!
In March 2026, traders monitor USO closely as OPEC+ decisions, U.S. inventory reports, and potential Middle East escalations influence crude prices. This article dissects the short-term trend, pivotal support and resistance zones, RSI/MACD signals, volume patterns, and a balanced outlook to equip traders with educational insights.
Current Price Trend in March 2026
USO displays a range-bound trend in early March 2026, oscillating between recent highs and lows after a strong rally from late 2025 lows. The ETF hovers near its 50-day moving average around $79.89, with the 20-day MA providing short-term resistance overhead and the 200-day MA at approximately $74.67 acting as firm support below.
Recent price action includes a bounce from February swing lows followed by a test of upper range limits, reflecting indecision between buyers and sellers. Major swings align with weekly oil inventory data releases, educating traders on how moving averages filter noise—price holding above the 50-day suggests potential for range expansion higher, while a dip below could signal renewed weakness.
This consolidation phase builds on elevated volumes from prior breakouts, but fading momentum on rallies warns of possible downside tests. Retail traders learn from this setup that range trading thrives on defined boundaries, with breakouts confirmed by MA crossovers or volume surges.
Key Support and Resistance Levels
Support levels serve as potential buying opportunities during pullbacks, often coinciding with historical pivots.
Near recent swing lows around the 200-day moving average ($74.67)—a critical long-term floor tested during 2025 corrections, drawing institutional interest.
Around the 50-day moving average ($79.89)—dynamic support where March pullbacks have stabilized, reinforced by round numbers.
Previous gap fill from early March—a technical void that frequently acts as a magnet for price retracements.
February consolidation lows—a high-volume zone signaling accumulation if retested.
Resistance levels cap upside rallies until decisively broken, typically at prior peaks.
Close to the 20-day moving average—short-term overhead barrier on intraday bounces.
Recent swing high near the year-to-date peak (approaching $124.07)—psychological resistance with profit-taking history.
Upper range boundary from mid-February—a level where sellers emerged amid supply glut fears.
Round numbers above current trading near $120—attractive targets for shorts covering positions.
A sustained break above key resistances might signal bullish continuation toward year highs, prompting traders to consider long setups with stops below supports. Conversely, a close below major supports could indicate bearish acceleration, encouraging caution or short-side strategies as oil demand worries intensify.
Indicators – RSI, MACD, Volume
The Relative Strength Index (RSI) for USO registers neutral readings around 50-55 in March 2026, avoiding overbought or oversold extremes and indicating balanced momentum with room for directional moves.
MACD reveals a flattening histogram with the line hovering near the signal, suggesting waning momentum after recent swings—traders watch for bullish crossovers above zero or bearish dives below for confirmation of trend shifts.
Volume patterns show spikes during range tests, particularly on downside probes, while rallies occur on average participation—rising volume on breaks would validate new trends, but declining volume on pullbacks hints at underlying support.
Short-Term Outlook for USO in March 2026
Overall, USO’s technical setup points to continued range trading in March 2026, with price respecting moving averages and neutral indicators amid steady oil fundamentals. Supportive volume on lows bolsters the case for bounces, though macro catalysts could trigger breakouts.
Traders watch EIA inventory reports weekly for volatility spikes.
Hold above 50-day MA ($79.89) for range stability or upside bias.
Geopolitical flares in oil-producing regions as breakout triggers.
Correlation with broader energy ETFs like XLE for confirmation.
Upcoming OPEC+ meetings as potential catalysts for supply shifts.
Risks and Important Notes
Oil prices react sharply to unforeseen events like demand shocks, sanctions, or recession signals, potentially invalidating technical levels overnight. Leveraged oil trades amplify risks, so disciplined stop-losses and position sizing remain essential.
This analysis educates on standard tools and patterns—past performance doesn’t guarantee future results, and it’s not personalized financial advice. Consult your risk profile and conduct due diligence.
For deeper dives, explore our technical analysis on energy peers like XLE (Energy Select Sector SPDR) or broader commodity ETFs. Bookmark for updates and trade responsibly!