
SQQQ Technical Analysis: Short-Term Trend, Support, and Resistance in March 2026
ProShares UltraPro Short QQQ (SQQQ) is a leveraged inverse ETF designed to deliver three times the opposite daily performance of the Nasdaq-100 Index, before fees and expenses. Traders watch SQQQ closely amid tech sector volatility, as it amplifies moves in a market dominated by big tech names like those in the QQQ. This article breaks down the current trend, key support and resistance levels, technical indicators like RSI and MACD, and a short-term outlook for March 2026 to help retail traders spot potential setups.
With President Trump’s pro-business policies influencing markets since his 2025 inauguration, leveraged ETFs like SQQQ have seen heightened interest as hedges against Nasdaq rallies or bets on corrections. We’ll cover price action relative to moving averages, critical levels to monitor, indicator signals, and what traders might watch next, all while emphasizing risk management.
Current Price Trend in March 2026
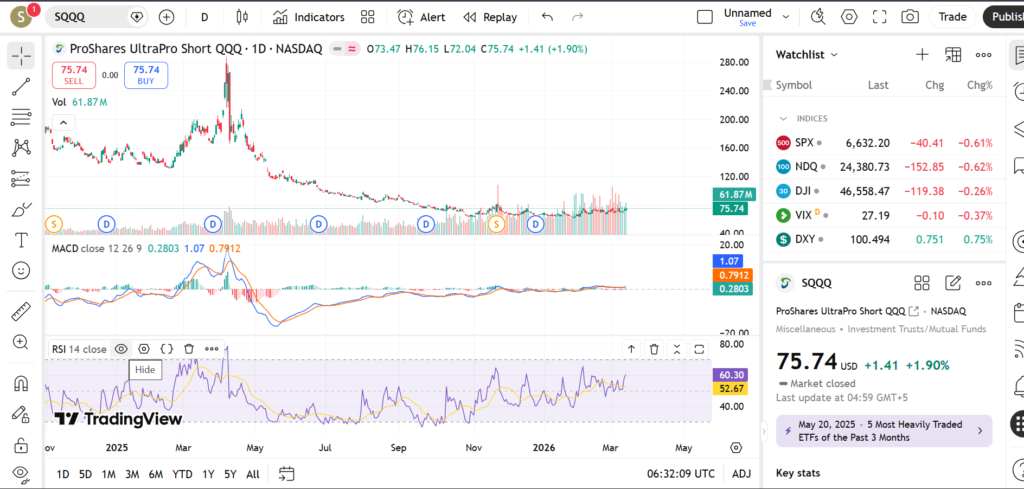
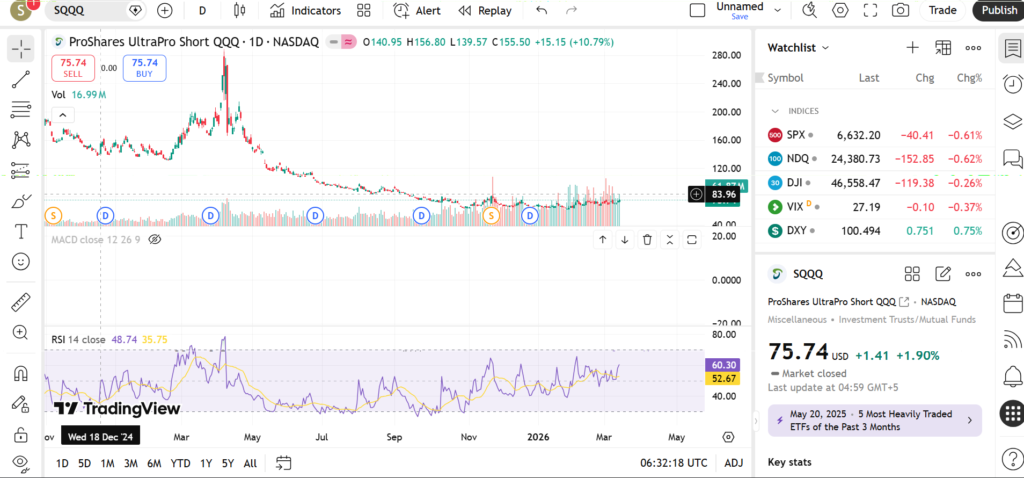
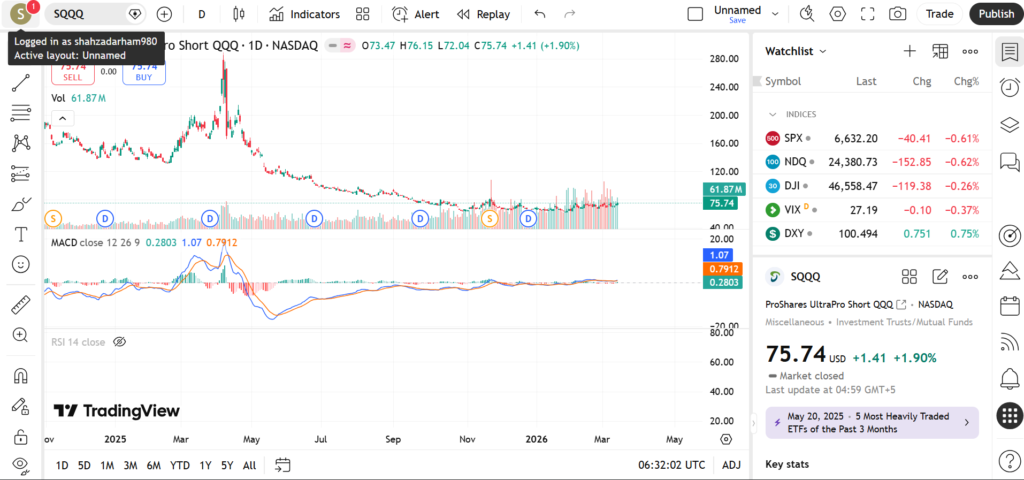
SQQQ has been navigating a choppy downtrend in early March 2026, reflecting the Nasdaq-100’s resilience amid AI-driven gains and steady economic data. Recent price action shows the ETF testing lower after a sharp rally from late February lows, with swing highs forming near prior resistance zones but failing to sustain upward momentum.
The 20-day moving average acts as dynamic resistance, sloping downward as the short-term trend remains bearish for SQQQ, while the 50-day MA provides a midpoint for potential pullbacks. The 200-day MA, far above current levels, underscores the longer-term inverse pressure from QQQ’s uptrend; traders may watch crossovers here for trend shifts. Major swings include a recent low near multi-month support, followed by a 10-15% bounce that stalled, keeping the structure educational for spotting range-bound trading.
Key Support and Resistance Levels
Key support levels for SQQQ include:
- Near the recent swing low from early March, around levels tested multiple times, acting as a psychological floor where buyers stepped in during prior dips.
- The 50-day moving average, which has held as support in past consolidations, coinciding with a round number that attracts volume.
- A gap fill zone from February’s volatility, where unfilled gaps often draw price for completion.
- Deeper support near the 52-week low area, bolstered by historical volume clusters.
Resistance levels include:
- The 20-day moving average, serving as immediate overhead pressure after recent failed rallies.
- A prior swing high from mid-February, now a magnet for shorts if retested.
- The 200-day MA convergence, a major hurdle signaling potential Nasdaq weakness if breached.
- Near-term round numbers aligning with Fibonacci retracements from the monthly high.
A break above key resistance like the 20-day MA could signal short-covering momentum, potentially targeting the next swing high and indicating fading bearish pressure on the Nasdaq. Conversely, a drop below major support near recent lows might accelerate downside, pointing to stronger QQQ upside and prompting traders to reassess positions.
Indicators – RSI, MACD, Volume
RSI on the daily chart for SQQQ sits in neutral territory around mid-range levels, neither overbought nor oversold, suggesting room for movement in either direction without extreme exhaustion. This balance could indicate consolidation before a directional breakout, as readings hover away from 70/30 extremes seen in prior volatile swings.
MACD shows a bearish alignment with the signal line below zero, though momentum appears to be fading as histogram bars shrink, hinting at possible convergence rather than a fresh crossover. Traders might watch for a bullish divergence if price makes new lows on contracting MACD, which could foreshadow a relief rally.
Volume has been rising on downside moves, supporting the prevailing inverse trend, while pullbacks to resistance see lighter participation, a classic sign of weak upside conviction. Recent spikes coincided with Nasdaq news events, amplifying SQQQ’s moves—watch for sustained high volume to confirm any trend continuation.
Short-Term Outlook for SQQQ in March 2026
The technical picture for SQQQ in March 2026 points to continued range-bound action within a broader downtrend, with Nasdaq strength capping upside potential but support holding firm so far. Leveraged nature amplifies daily swings, making it ideal for tactical trades rather than long holds, as compounding effects erode value in sideways markets.
- Traders are watching a break above the 20-day MA for short-covering signals toward February highs, potentially triggered by tech sector profit-taking.
- Key downside test at recent swing lows, where failure could open deeper retracements if QQQ pushes new records.
- Upcoming Fed rate decisions or inflation data as macro catalysts that might jolt volume and validate levels.
- Nasdaq earnings from megacaps like Nvidia or Apple, which could inversely spike SQQQ on misses.
- Broader sector rotation out of tech into value stocks, boosting SQQQ if confirmed by rising volume.
Risks and Important Notes
Technical levels in SQQQ can fail unexpectedly due to sudden macro events like policy shifts under President Trump or geopolitical tensions impacting tech supply chains. High leverage means even small Nasdaq moves result in tripled inverse exposure, heightening drawdown risks in trending markets.
Past performance isn’t indicative of future results, and these ETFs suit experienced traders who monitor positions daily. Always use stop-losses and position sizing to manage volatility.
For more insights, check our technical analysis on QQQ or TQQQ for the long side, or explore inverse ETFs like SPXU. Stay informed with daily updates—what levels are you watching this week?
SQQQ Technical Analysis: Trend, Support, and Resistance in March 2026
ProShares UltraPro Short QQQ (SQQQ) is a leveraged inverse ETF designed to deliver three times the inverse (-3x) daily performance of the Nasdaq-100 Index, making it a popular tool for traders betting against tech-heavy Nasdaq growth stocks. Traders watch SQQQ closely during periods of market volatility, especially when tech sector leaders like Apple, Microsoft, and Nvidia face pressure from interest rate hikes, earnings misses, or geopolitical tensions. This article breaks down SQQQ’s short-term trend, key support and resistance levels, technical indicators like RSI and MACD, and a balanced outlook for March 2026.
In March 2026, with President Trump’s pro-business policies potentially fueling Nasdaq rallies amid ongoing AI and semiconductor booms, SQQQ serves as a hedge for bearish traders or those expecting pullbacks. We’ll cover price action relative to moving averages, critical levels to monitor, indicator signals, and what traders might watch next, all while emphasizing risk management for retail traders.
Current Price Trend in March 2026
SQQQ has likely been in a short-term downtrend throughout early March 2026, reflecting the Nasdaq-100’s resilience amid strong tech earnings and economic optimism under the current administration. Recent price action shows the ETF testing lower swing lows, potentially carving out a series of descending highs since the month’s open, as bullish momentum in underlying tech stocks pressures inverse positions.
The 20-day moving average (MA) may be sloping downward and acting as dynamic resistance, while the 50-day MA provides a steeper decline, confirming bearish bias; the 200-day MA, farther above, represents a major long-term hurdle that SQQQ has struggled to reclaim. Key swings include a potential early-month rally attempt that faded near prior resistance, followed by a pullback toward monthly lows—traders often use these MAs to gauge if momentum is shifting, such as a crossover where price holds above the 20-day MA signaling possible stabilization.
Key Support and Resistance Levels
Support Levels:
- Near-term support around recent swing lows from early March, coinciding with a prior gap fill or the 20-day MA—traders watch this as a potential bounce zone if Nasdaq overextension leads to profit-taking.
- Intermediate support at the 50-day MA or a round number like the February close equivalent, important as historical reversal points during past Nasdaq corrections.
- Deeper support near the 200-day MA or 52-week lows, a psychological level where heavy buying emerged in prior downturns, often drawing institutional interest.
- Gap support from mid-2025 unfilled gaps, which could act as a magnet if selling accelerates.
Resistance Levels:
- Immediate resistance at the 20-day MA, a level where recent rallies have stalled, tied to short-covering in Nasdaq futures.
- Stronger resistance near the 50-day MA or recent swing highs, significant as they align with Fibonacci retracement levels from larger declines.
- Upper resistance around the 200-day MA or prior monthly highs, a tough barrier signaling potential Nasdaq weakness if breached.
- Psychological resistance at round numbers near the 52-week high zone, where profit-taking often intensifies.
A break below key supports like the 50-day MA could signal accelerated downside for SQQQ, hinting at prolonged Nasdaq strength and encouraging bearish adds; conversely, a close above the 20-day MA resistance might indicate fading inverse momentum, prompting traders to lighten shorts.
Indicators – RSI, MACD, Volume
The Relative Strength Index (RSI) on SQQQ likely shows oversold conditions in March 2026, hovering below 30 on the daily chart after extended declines, which could hint at a short-term relief bounce even in a broader downtrend—retail traders use this to spot potential mean reversion without assuming reversals.
MACD may display bearish momentum with the signal line below zero and fading histogram bars, suggesting downward pressure persists, though a narrowing gap could indicate slowing downside if Nasdaq rallies lose steam. Volume patterns often reveal rising activity on SQQQ pullbacks (down days for the ETF), confirming conviction in bearish bets, while lighter volume on rallies points to weak upside attempts amid dominant Nasdaq buying.
Short-Term Outlook for SQQQ in March 2026
Overall, SQQQ’s technical setup in March 2026 leans bearish for the ETF itself, driven by a probable Nasdaq uptrend fueled by tech innovation and policy tailwinds, keeping price action pinned below key MAs with oversold RSI offering limited bounce potential. Traders may eye stabilization near supports, but sustained breaks lower could extend losses unless underlying index catalysts shift.
What traders are watching:
- Breach of 20-day MA resistance for early bullish divergence in SQQQ.
- Nasdaq-100 reaction to upcoming Fed minutes or CPI data in late March.
- Tech earnings from FAANG stocks, which could spike volatility.
- Volume surges on downside days signaling stronger conviction.
- 200-day MA test as a major inflection for long-term bias.
Risks and Important Notes
Technical levels on leveraged ETFs like SQQQ can fail abruptly due to sudden macro events, such as unexpected Fed pivots, geopolitical flares, or sector rotations away from tech. Decay from daily resets amplifies risks in sideways markets, so retail traders should use tight stops and position sizing.
This analysis is educational and based on common technical patterns—past performance doesn’t predict future results, and it’s not personalized financial advice; always consult professionals and consider your risk tolerance.
For more insights, check our technical analysis on related inverse ETFs like QID or leveraged tech plays, plus competitor breakdowns for Nasdaq-focused funds. Stay informed and trade smart!