
Direxion Daily Small Cap Bear 3X Shares (TZA) Analysis
The Direxion Daily Small Cap Bear 3X Shares (TZA) is a leveraged inverse ETF seeking 3x the opposite daily performance of the Russell 2000 Index, targeting traders bearish on small-cap stocks. It belongs to the leveraged ETF sector focused on shorting equities, drawing attention in March 2026 amid small-cap underperformance versus large caps and recession fears. This article examines TZA’s trend, pivotal support/resistance, indicators like RSI and MACD, and near-term trading outlook.
TZA thrives in small-cap selloffs, amplified by 3x leverage, making it a tool for hedging or speculation. We’ll unpack the charts to help retail traders navigate its volatile swings this month.
Current Price Trend in March 2026
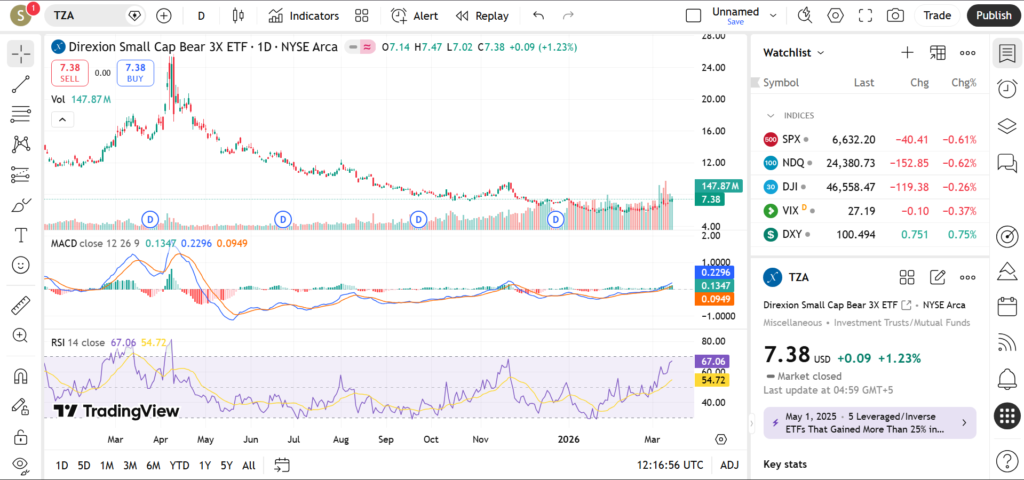
TZA exhibits a short-term uptrend in early March 2026, reflecting small-cap weakness as the underlying Russell 2000 faces pressure from high rates and earnings misses. Price action features bounces off the 20-day MA, with the 50-day acting as minor resistance—recent swings include a spike higher on broad market rotation away from small caps.
The 200-day MA lags below, underscoring leveraged decay in prolonged ranges, but short-term averages suggest momentum if small caps continue sliding; this teaches traders about inverse ETF behavior in trending markets.
Key Support and Resistance Levels
Support Levels:
- Near recent swing low (prior gap area): This level held in February 2026 dips, drawing shorts unwinding; a break below might accelerate downside due to leverage.
- 50-day MA confluence: Aligns with round numbers and past pullback lows—traders watch for defense here.
- 200-day MA (longer-term floor): Historical support from Q4 2025, where volume dried up.
Resistance Levels:
- Recent swing high near 20-day MA: Capped early March rallies, tied to Russell 2000 bounces; surpassing could target higher.
- Upper channel from January upmove: Fibonacci extension level signaling overextension risk.
- 52-week high zone: Psychological barrier with prior rejections.
Breaking above resistance might signal stronger bearish small-cap momentum for TZA bulls, while support breaches could indicate mean-reversion, alerting traders to cover shorts.
Indicators – RSI, MACD, Volume
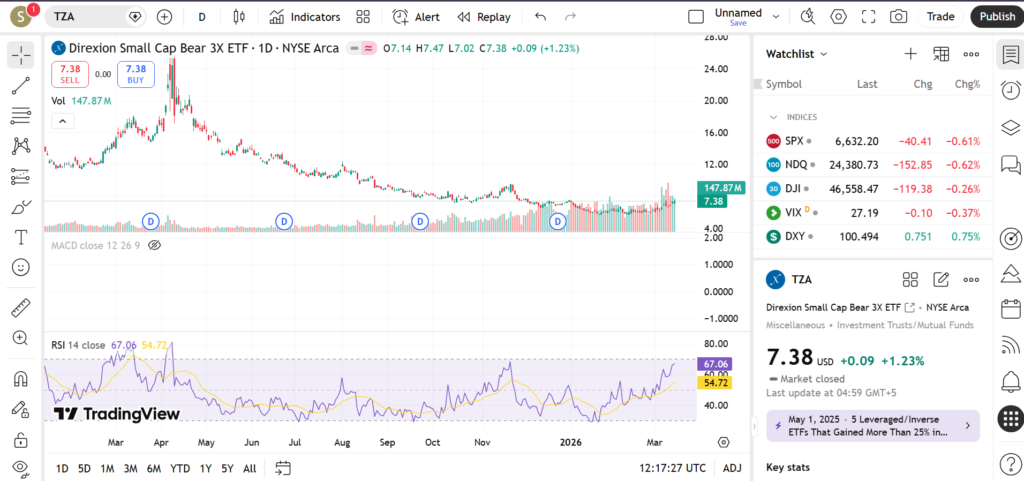
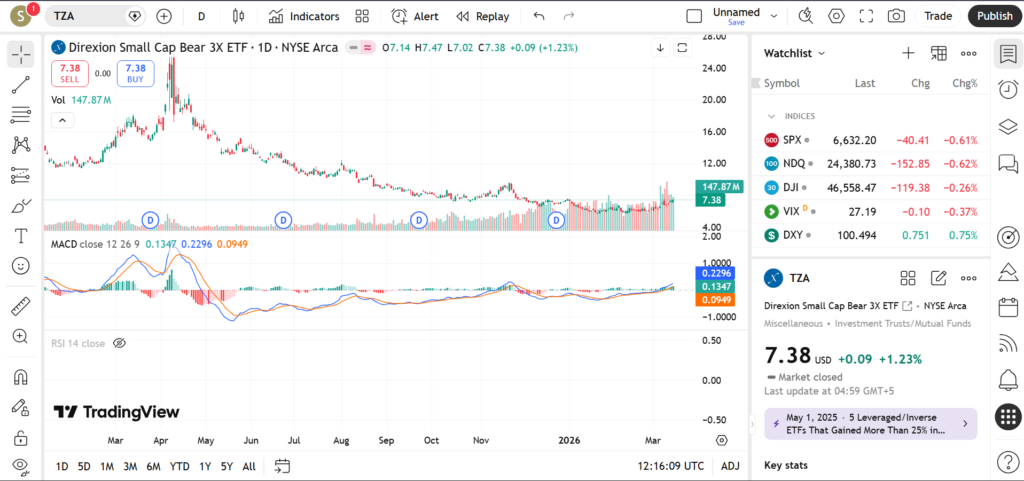
RSI sits elevated around 60-70 on daily charts in March 2026, flirting with overbought territory and warning of potential pullbacks—ideal for spotting exhaustion in leveraged plays. MACD displays bullish crossover with increasing histogram, pointing to building upside momentum for this bear ETF; fading lines would caution continuation.
Volume spikes on advances but tapers on retraces, supporting the uptrend but highlighting need for confirmation on pullbacks.
Short-Term Outlook for TZA in March 2026
TZA’s setup in March 2026 favors continuation higher if small caps weaken further, backed by favorable short-term averages and bullish MACD, though overbought RSI tempers enthusiasm. Traders might position around levels, mindful of leverage’s daily reset risks.
What traders are watching:
- Russell 2000 breakdown below its 200-day MA for TZA catalysts.
- Upcoming small-cap earnings reports or economic data like ISM.
- Resistance test at swing highs with volume confirmation.
- Broader market rotation from small caps to megacaps.
- Fed policy signals impacting rate-sensitive small caps.
Risks and Important Notes
Leveraged ETFs like TZA amplify losses in ranges or reversals due to compounding effects and volatility decay—news like surprise rate cuts or positive economic data can invalidate setups quickly. This analysis is for education only, not advice; use proper risk management and avoid overnight holds in 3x products.
Explore our coverage of TNA (small-cap bull counterpart) or SOXS for sector bear plays. Bookmark for updates!