
ProShares UltraPro QQQ (TQQQ) Technical Analysis
ProShares UltraPro QQQ (TQQQ) is a 3x leveraged ETF tracking the daily performance of the Nasdaq-100 Index, providing amplified exposure to tech-heavy large-cap growth stocks. In March 2026, traders eye TQQQ amid Nasdaq volatility, with prices around $48-$52 after pullbacks from higher levels earlier in the year. This piece examines trends, supports, resistances, indicators, and outlook for informed trading decisions.
TQQQ belongs to the technology and growth sector via QQQ leverage, drawing interest now due to AI/tech sector swings and economic data impacts. Recent action shows consolidation post-downtrend, with potential for rebounds if supports hold.
Current Price Trend in March 2026
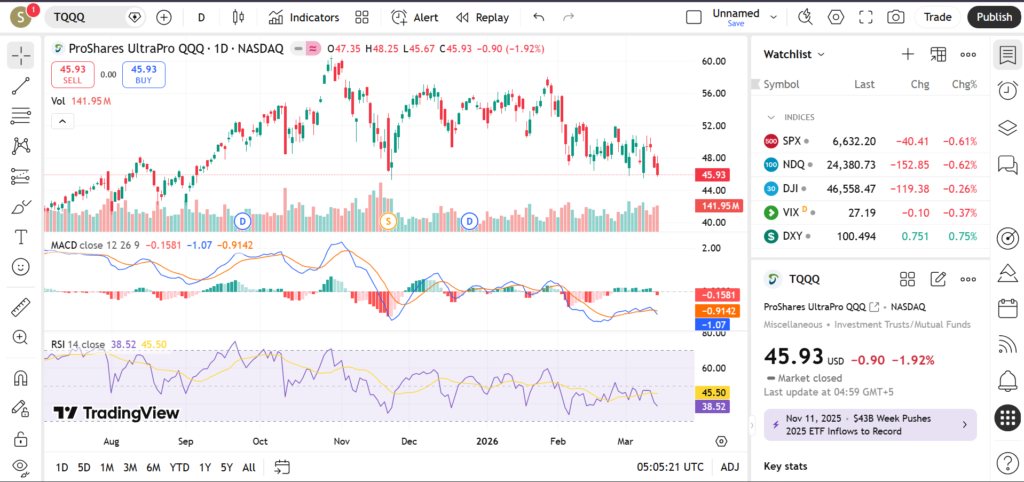
TQQQ exhibits a short-term range-bound trend in early March 2026, trading sideways around $48-$52 after a broader downtrend from 2025 highs near $80+. Price has stabilized post-pivot low in February, up slightly but below key averages.
It hovers above the 200-day MA near $48.69 but below 50-day at $52.4 and 100-day at $54.3, with 20-day MA around $49.4 indicating neutral short-term bias. Major swings include a rebound from $46 support, but failure to reclaim $52 resistance caps upside.
Key Support and Resistance Levels
Key support levels for TQQQ:
- $46.06-$46.45, recent lows with volume accumulation and 200-day MA alignment, strong rebound zone.
- $43.14, next Fibonacci extension and prior swing low, potential deeper test if broken.
- $49.76 accumulated volume support from recent pivots.
Resistance levels include:
- $51.35, immediate overhead near 20/50-day MAs, breakout could signal strength.
- $52.4, 50-day MA and recent highs, key for bull continuation.
- $54.3, 100-day MA matching prior resistance cluster.
Breaking above $51.35 might target $52-$54 with Nasdaq strength, while sub-$46 could accelerate toward $43, signaling bear resumption.
Indicators – RSI, MACD, Volume
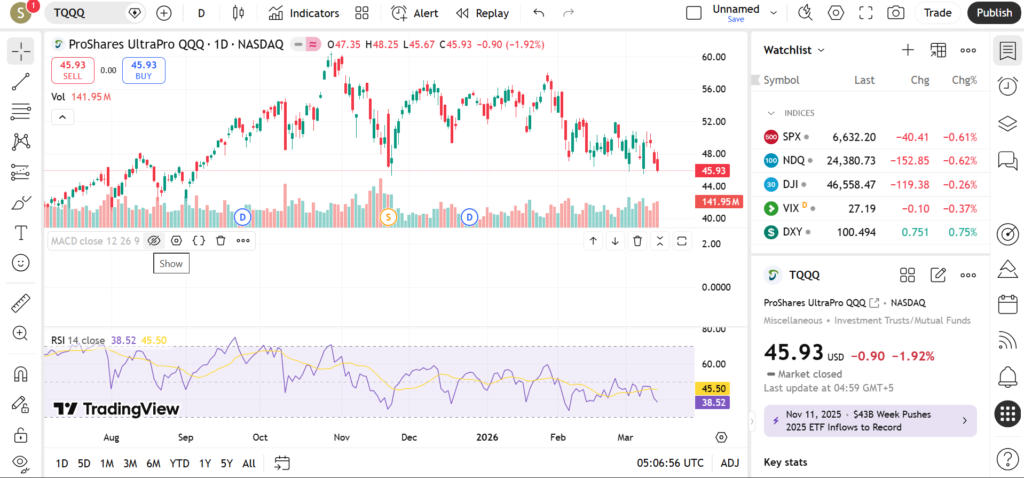
RSI at 38.9-40.59 shows neutral to oversold conditions, neither extreme but approaching levels where bounces often occur in leveraged tech ETFs. This suggests momentum could shift if volume supports.
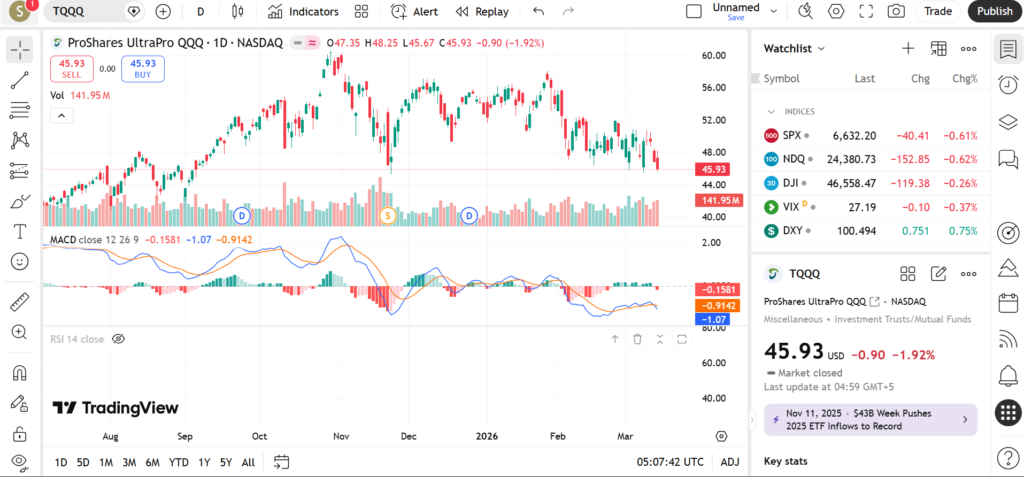
MACD at -0.89 with line below signal indicates fading bearish momentum, potential for crossover if price holds supports. Histogram may narrow, hinting at consolidation.
Volume behavior shows spikes on downside tests like February lows but average on recoveries, with potential uptick needed for bullish confirmation.
Short-Term Outlook for TQQQ in March 2026
TQQQ’s setup leans neutral-bullish short-term in March 2026, with price above long-term MA, neutral RSI, and MACD poised for possible relief amid range trade. Watch for Nasdaq catalysts to tip the balance.
- Support defense at $46 amid tech earnings season.
- Breakout above $51.35 toward 50-day MA.
- QQQ index moves and Fed rate updates as catalysts.
- Volume surge on upside for momentum confirmation.
- Nasdaq-100 sector rotation impacts.
Risks and Important Notes
Levels can break on unexpected tech news, earnings misses, or macro reversals like rate hikes, especially in 3x leveraged products prone to compounding effects. Past performance does not predict future; manage position sizes accordingly.
Educational content only—not financial advice. Conduct your own due diligence.
Explore analysis on QQQ, SOXL, or other tech-leveraged ETFs for broader context.