
Examine RIG stock price action, drilling earnings, technical analysis, and outlook. Is RIG stock a buy amid oil recovery? See analyst targets, risks, and forecasts now.
Introduction
Transocean Ltd. owns the world’s largest offshore drilling fleet. It contracts rigs to oil companies for deepwater exploration and production. Investors track RIG stock now due to rising day rates and contract backlog growth. Energy service firms benefit from oil above $80 despite offshore project delays.
Oilfield services rebound slowly. RIG stock price closed at $6.28 on March 12, 2026, last market data shows. Everyday investors weigh recovery potential against debt concerns.
Latest stock Price & Trend
RIG stock closed at $6.28 on March 12, 2026, per Nasdaq data after dropping 0.48% that day. Volume hit 30.82 million shares with price ranging $6.15-$6.31. Five-day trend declined 1.57% over 10 sessions showing recent weakness.
One-month performance consolidation up 5.90% from March 6 lows around $5.93. Three-month sideways pattern emerged after early gains. Six-month view mixed with year-to-date flat performance.
52-week range spans recent lows near $5.85 to higher levels last fall. Overall trend neutral consolidation signals patience for offshore contract catalysts.
Technical Analysis
Support holds at $6.15 matching recent session lows. Resistance near $6.50 aligns with March options strikes. RSI neutral territory after recent pullback—RSI identifies overbought conditions above 70 or oversold below 30 for entry timing.
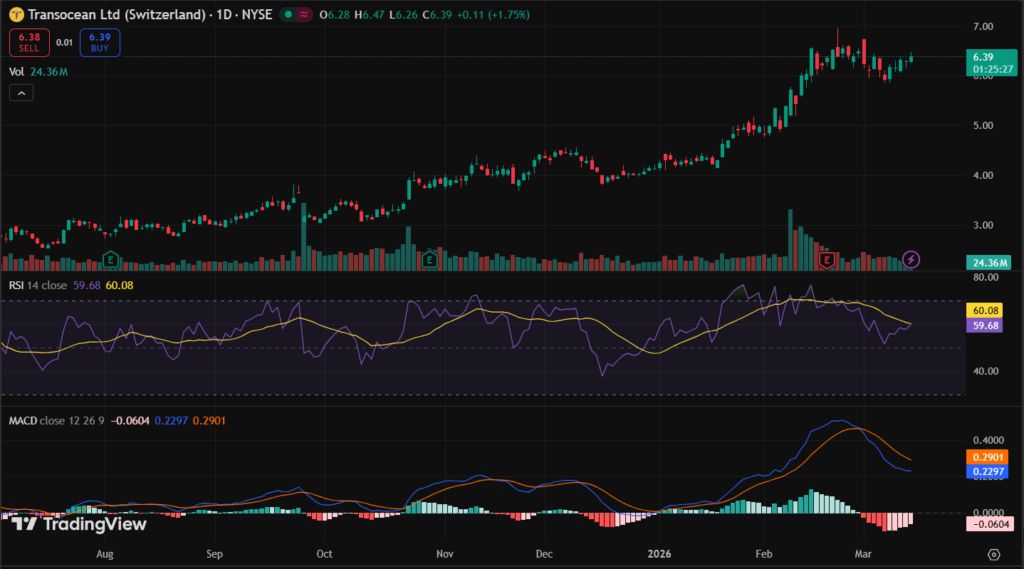
MACD shows consolidation pattern with flat lines. 50-day moving average around $6.20 tracks closely with 200-day near $6.40, no golden cross evident—this compares short-term versus long-term trends signaling direction changes.
Trading volume rose 2.19 million shares on down day indicating distribution. RIG technical analysis advises beginners watch $6 support for breakdown risk.
Analyst Ratings & Price Targets
Limited fresh ratings available with neutral consensus. Price forecasts range $2.83 average March 2026 per AI models, high end $4.22 by June. No major Wall Street upgrades recent months.
Firms cautious on debt levels despite backlog. Neutral stance reflects 2026 trading channel $1.87-$4.22—investors use for RIG forecast context.
Insider Activity
No significant recent insider transactions reported in filings. Management focused on contract execution over equity moves. Steady patterns without large buys or sells.
Trends show operational discipline rather than personal confidence signals. RIG insider activity remains neutral indicator currently.
Valuation Analysis
Trailing P/E unavailable on losses, forward estimates cautious. Price-to-sales low reflecting cyclical recovery. Revenue growth tied to dayrate increases from current $350 levels.
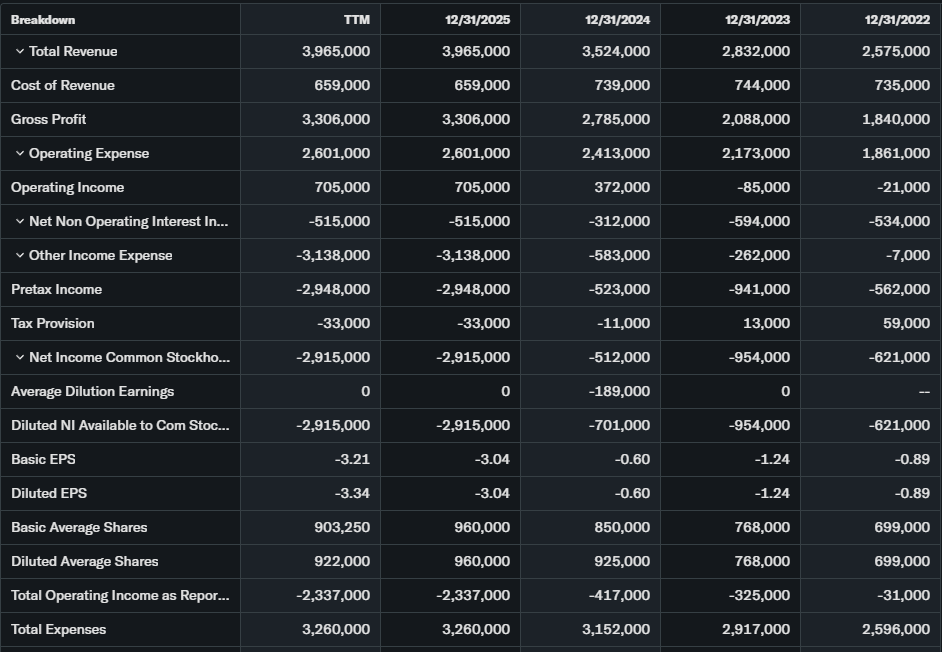
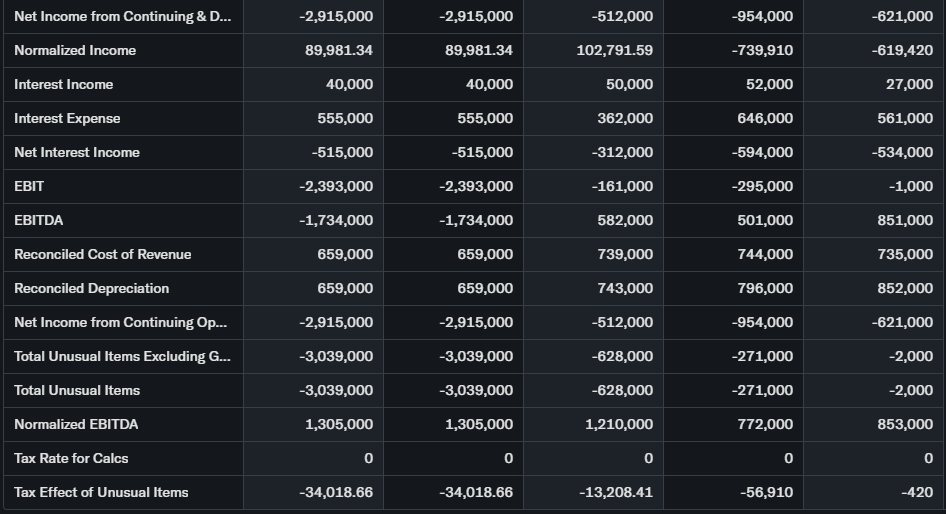
EPS projections improve with rig utilization. Free cash flow pressures persist from debt service, $8 billion net debt position. Compared to Valaris peers, RIG stock undervalued on fleet quality but debt weighs heavily.
Recent Earnings & Catalysts
Q4 results showed backlog growth to multi-year highs near $9 billion. Revenue beat modest estimates despite idle rigs. Guidance emphasizes contract tenders.
Catalysts include Deepwater Hercules contract and Permian exit proceeds. Earnings reaction muted with focus on utilization rates impacting RIG stock price.
Bullish Case
Day rates climb toward $400k targeting 75% utilization. Backlog provides revenue visibility through 2027. Newbuild harsh environment rigs command premiums.
Cost controls improve EBITDA margins progressively. RIG revenue growth accelerates with global offshore spend.
Bearish Case
Oil price volatility delays final investment decisions. High debt service consumes cash flows. Rig oversupply lingers from pandemic builds.
Dayrate cycle peaks early versus 2014 boom. Offshore capex growth slows post-2026.
Market Sentiment & Investor Psychology
Short interest elevated reflecting leverage concerns. Options show balanced calls/puts around $6.50 March strikes. Institutions maintain core positions.
Retail traders accumulate dips seeking oil recovery. Sentiment neutral with value bias over momentum currently.
Short-Term Outlook
Consolidation persists $6-$6.50 range per technicals. Volume distribution warns downside risk to $5.85 support. Sideways grind likely absent oil breakout next weeks.
Medium to Long-Term Outlook
Floaters market tightens with limited newbuilds. Offshore FIDs rise 15% annually through 2028. Largest harsh environment fleet competitive moat.
Debt reduction trajectory critical. RIG forecast suggests watch for dayrate momentum—accumulate below $6 cautiously.
FAQ
Is RIG stock a buy right now?
Wait for $6 support confirmation amid debt concerns.
What is the RIG stock price target?
2026 channel $1.87-$4.22 per forecasts, neutral consensus.
What are major risks for RIG stock?
Debt burden, rig oversupply, oil volatility.
Next RIG earnings date?
Late April 2026 Q1 expected.
RIG RSI analysis summary?
Neutral post-pullback, watch oversold levels.
Suggestion
- Compare with Opendoor stock analysis
- See our offshore drilling outlook
- Read SLB stock forecast 2026
Conclusion
Watchlist RIG stock currently. Backlog growth potential offset by leverage—buy only on proven dayrate traction and debt progress.
Disclaimer: This article is for informational purposes only and not financial advice.