
Direxion Daily S&P 500 Bear 1X Shares (SPDN) – March 2026 Technical Breakdown
The Direxion Daily S&P 500 Bear 1X Shares (SPDN) is an exchange-traded fund (ETF) designed to deliver the inverse daily performance of the S&P 500 Index, before fees and expenses. This means when the broad market declines, SPDN aims to rise by a similar percentage on a daily basis, making it a popular tool for traders betting on short-term S&P 500 weakness or hedging long equity positions. As a leveraged inverse ETF in the equity broad market sector, SPDN doesn’t focus on a specific industry but mirrors the opposite moves of the S&P 500’s diverse holdings across technology, finance, healthcare, and more.
Traders are watching SPDN closely in March 2026 amid ongoing market volatility, potentially driven by macroeconomic factors like Federal Reserve policy shifts, inflation data releases, or geopolitical tensions that could pressure the S&P 500. With President Trump’s administration influencing economic policies since his 2025 inauguration, equity markets have seen choppy action, amplifying interest in bearish instruments like SPDN. This article provides a detailed technical analysis for the month, covering price trends, key support and resistance levels, critical indicators like RSI and MACD, and a short-term outlook to help retail traders navigate potential opportunities.
Current Price Trend in March 2026
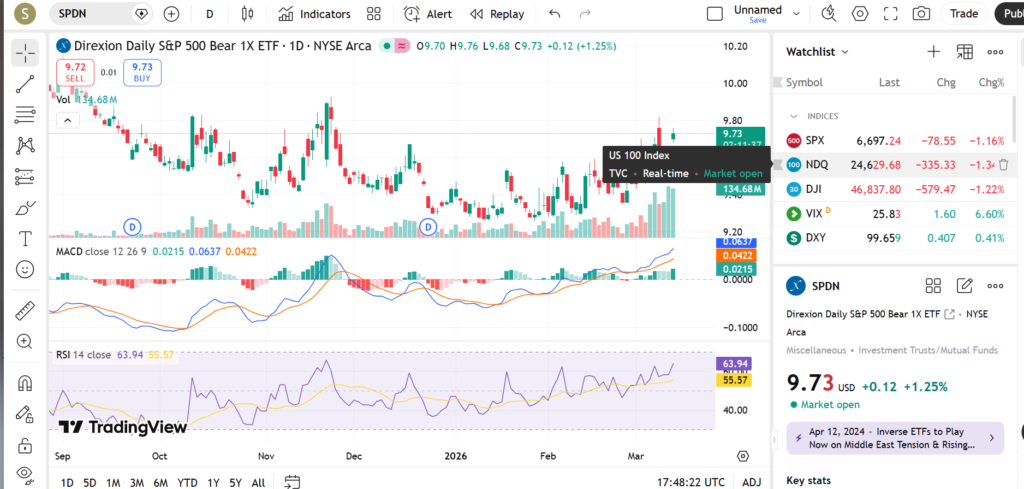
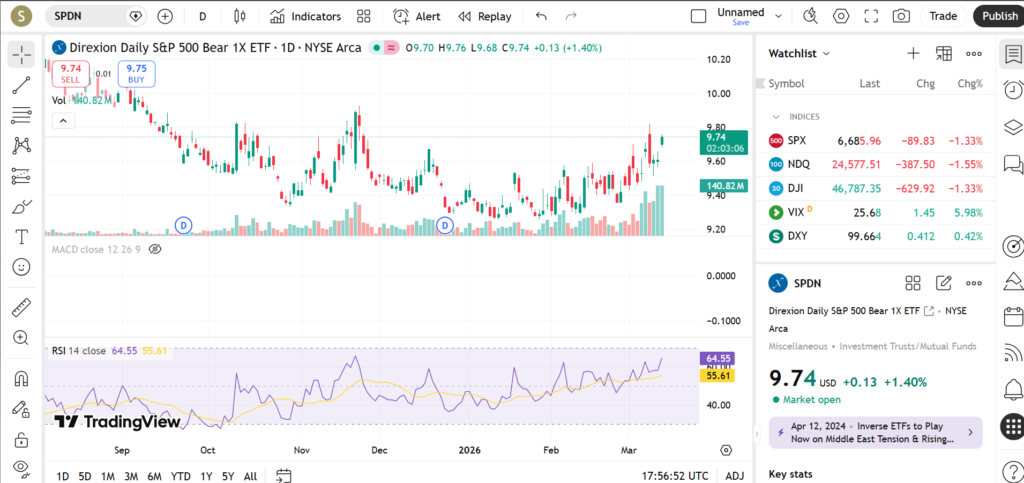
SPDN has been exhibiting a short-term uptrend in March 2026, consistent with its inverse nature during periods of S&P 500 consolidation or mild pullbacks. Recent price action shows the ETF climbing from early-month lows, forming higher lows amid broader market hesitation, which benefits bearish vehicles like SPDN. This move aligns with the 20-day moving average sloping upward and acting as dynamic support, while the 50-day MA remains relatively flat, suggesting momentum but not a full-blown bull run for the ETF.
Major swings include a notable rally from a mid-February trough, testing levels near prior resistance turned support, with the 200-day moving average lagging below as a longer-term bearish anchor for the underlying index. Educational note: Moving averages help smooth price data—when shorter ones like the 20-day stay above longer ones like the 200-day, it may indicate building short-term strength, but traders watch for crossovers that could signal trend reversals. Volume has picked up on these upswings, reinforcing the trend without overextension.
Key Support and Resistance Levels
Support levels for SPDN in March 2026 cluster around recent swing lows and dynamic averages, providing potential floors for pullbacks.
- Primary Support near recent swing low (approx. below early March lows): This level, tied to a prior gap fill from late February, matters as it aligns with the 20-day MA; a hold here could signal continued upside momentum for bearish traders.
- Secondary Support at 50-day MA: Acting as a psychological buffer from February consolidation, a bounce off this could confirm the uptrend.
- Tertiary Support near round number below 200-day MA: Previous lows from Q1 2026 make this a high-conviction area; breaking below might indicate fading inverse strength if S&P 500 rebounds sharply.
Resistance levels cap the current rally, often coinciding with historical highs and Fibonacci retracements.
- Primary Resistance near recent swing high: This prior peak from late 2025, near a 52-week high zone, serves as a key barrier; breaking above could signal stronger bearish conviction on S&P weakness.
- Secondary Resistance at upper Bollinger Band: Dynamic resistance from volatility bands, important for overextension risks.
- Tertiary Resistance near 38.2% Fibonacci from 2025 high: A round number cluster; surpassing it might target deeper S&P pullbacks.
A decisive break above primary resistance could encourage traders to eye further gains, potentially signaling accelerated S&P 500 downside. Conversely, a drop below primary support might prompt caution, hinting at a range-bound or reversal setup if market sentiment flips bullish.
Indicators – RSI, MACD, Volume
The Relative Strength Index (RSI) on SPDN’s daily chart in March 2026 hovers in neutral territory around 55-60, neither overbought (above 70) nor oversold (below 30), suggesting room for continuation without immediate exhaustion. This reading indicates balanced momentum, where traders may watch for divergence—if price makes new highs but RSI fails to follow, it could foreshadow a pullback. RSI helps gauge speed and change of price movements, making it a staple for spotting potential reversals.
MACD shows a bullish setup with the signal line crossover above the zero line early in the month, reflecting increasing upward momentum for SPDN as S&P 500 momentum fades. The histogram bars are expanding positively, but traders note if they start contracting, it might signal fading bearish pressure on the index. MACD, combining moving averages, highlights trend strength—bullish crossovers like this often precede extended moves.
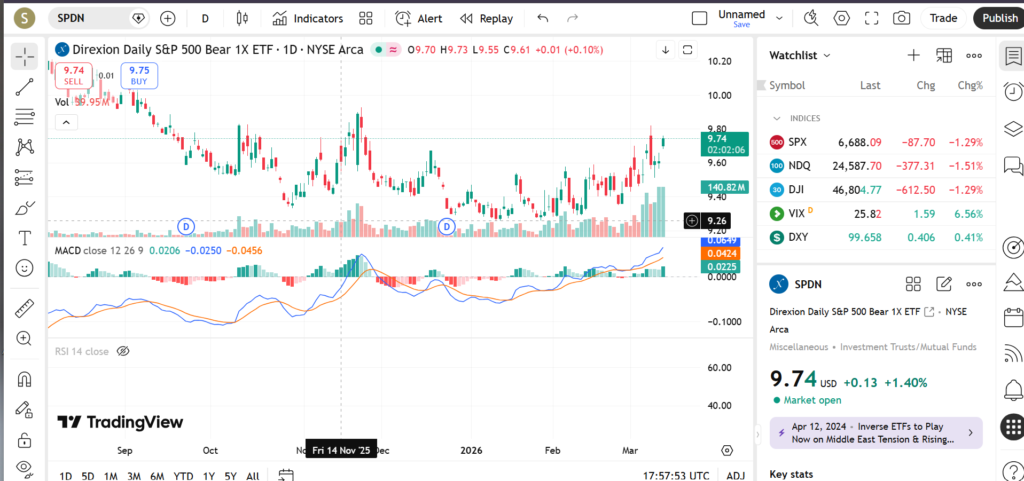
Recent volume behavior supports the uptrend, with spikes on rallies indicating conviction from bearish traders, while pullbacks see lighter volume, a healthy sign of non-panicked selling. No major distribution spikes yet, but watch for climactic volume that could precede reversals.
Short-Term Outlook for SPDN in March 2026
The technical picture for SPDN in March 2026 leans cautiously bullish in the short term, driven by its uptrend from recent lows, supportive indicators, and key levels holding firm amid S&P 500 range trading. With neutral RSI and positive MACD momentum, the ETF could test resistance if broader market weakness persists, but overbought risks loom if the index stabilizes. Traders may find opportunities in dips to support, balancing the inverse ETF’s daily reset nature which suits short holding periods.
What traders are watching:
- Break above primary resistance to confirm deeper S&P pullback potential.
- Hold at 20-day MA support amid upcoming macro events like Fed minutes or CPI data.
- RSI divergence or MACD histogram fade as early reversal clues.
- Volume surges on breaks, validating moves.
- Sector rotation away from tech-heavy S&P components boosting inverse plays.
Risks and Important Notes
Technical levels in SPDN analysis can fail unexpectedly due to sudden news like positive economic data, corporate earnings beats in the S&P 500, or policy shifts under the current administration that spark risk-on rallies. Inverse ETFs like SPDN amplify daily moves but suffer from compounding effects over multi-day holds, potentially eroding gains in choppy markets—always consider the prospectus for decay risks. This analysis is for educational purposes; retail traders should conduct their own research, use risk management like stop-losses, and consult professionals, as past performance doesn’t predict future results.
Ready to trade smarter? Bookmark this analysis and check our related technical breakdowns on inverse ETFs like SQQQ (for Nasdaq bears) or TZA (small-cap bears), plus S&P 500 bull counterparts like SPXL for balanced views. Subscribe for weekly updates on leveraged ETFs.