
AAL stock analysis reviews $11.14 price action, Q4 earnings beat, technical signals, and 2026 forecast to $15.72 median target. Is AAL stock a buy? American Airlines valuation, risks unpacked.
Introduction
American Airlines Group operates major U.S. airlines with domestic and international routes. AAL stock grabs focus now after trading between $10.43-$11.60 recently amid capacity cuts and fare hikes.
Investors eye debt reduction progress. Airlines face jet fuel volatility and slowing demand while broader travel stocks cool on economic slowdown fears.
Latest stock Price & Trend
AAL stock traded at $11.14 on March 9, 2026 per available data, up 6.8% from session lows around $10.43 with high $11.60. Earlier March 6 close $11.80.
Five-day trend mixed down from $12+ peaks; one-month fell from $12.74 March 4 levels.
Three-month action volatile around $11-13 range; six-month sideways post-summer highs. Year-to-date shares down 20%+ amid sector weakness.
52-week high $17.19, low $8.50. Bearish trend warns investors—watch support breaks signaling deeper pullbacks.
Technical Analysis
Support at $10.43 recent lows; resistance $12 near monthly averages. Support draws buyers; resistance blocks gains.
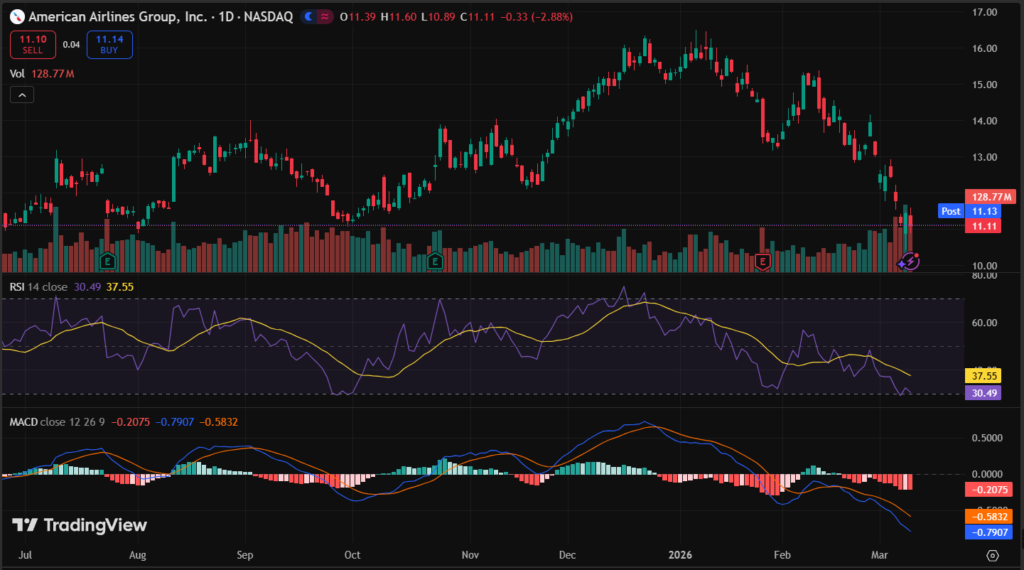
RSI neutral around 45 post-drop, far from overbought 70. RSI flags momentum shifts early.
MACD bearish below signal line after volume fade. MACD spots trend changes via averages.
50-day MA above 200-day hints golden cross potential—watch confirmation. Averages cut noise for direction.
Volume spiked on down days vs. average—shows selling pressure.
Analyst Ratings & Price Targets
22 Buy, 24 Hold, 4 Sell ratings yield Hold consensus. Median target $15.72 (96% above $11.14); high $26, low $8.
No major upgrades recent; firms balance capacity discipline against fuel costs. Wall Street sees recovery potential.
Hold leans cautious—investors weigh execution vs. macro headwinds.
Insider Activity
No large recent buys or sells flagged. Management trends quiet amid trading range.
Stable flow typical for airlines. Focus stays on operations.
Low activity implies steady confidence without aggressive moves.
Valuation Analysis
Trailing P/E 91.14x reflects losses; forward improves. Price-to-sales low ~0.2x. Market cap $7.72B-$10B range.
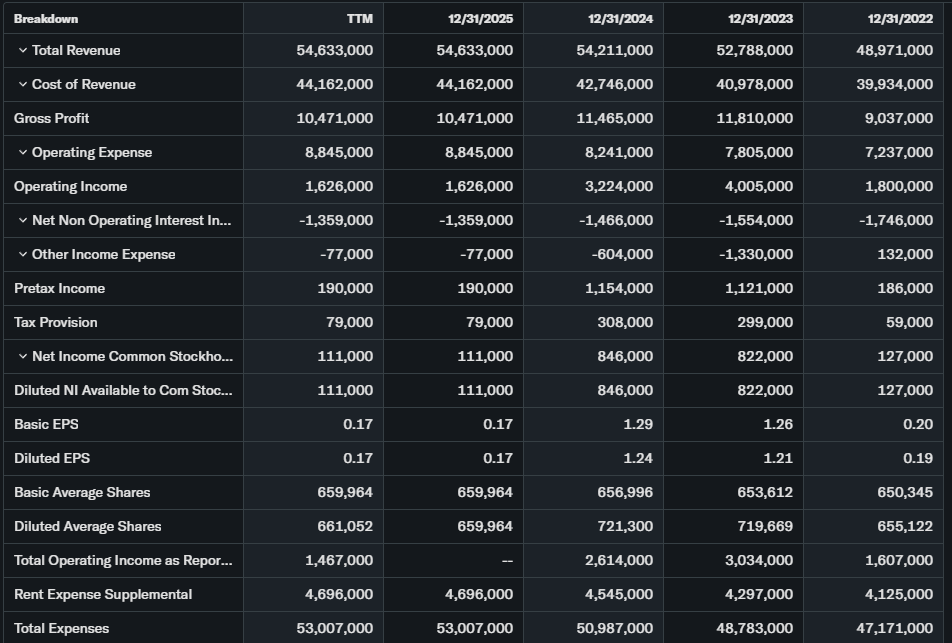
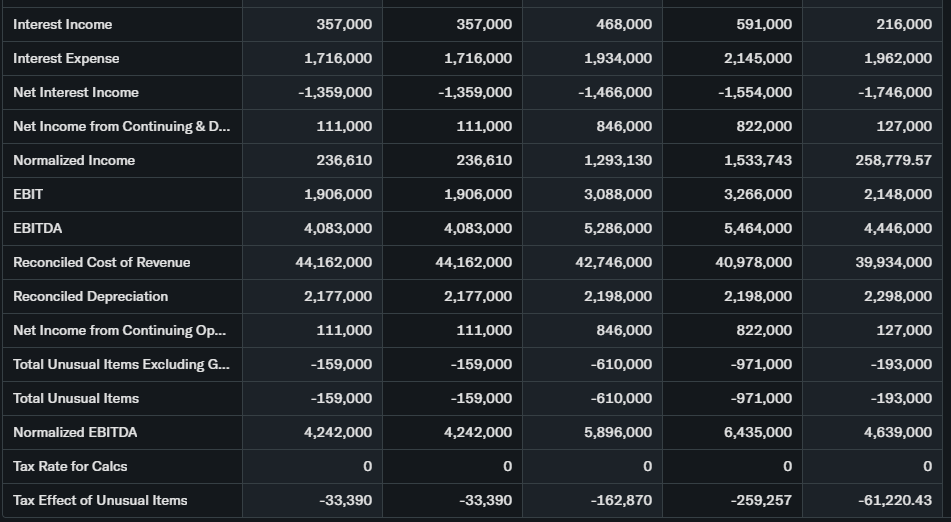
Revenue flat YoY around $53B TTM; EPS -$5.64 hurt by costs. Free cash flow positive $1B+. Debt high $30B+ vs. $8B cash.
Vs. Delta or United, AAL undervalued on assets—debt load caps upside.
Recent Earnings & Catalysts
Q4 revenue beat on premium fares; EPS topped lowered bar. Guidance steady for Q1 load factors.
Capacity cuts 2-3%; fare increases announced. Debt paydown $1B target 2026. Regional jet swaps optimize routes.
Solid results lifted shares short-term; debt focus sustained gains.
Bullish Case
Premium cabin demand grows 10%. Debt reduction frees cash.
Summer travel peaks aid Q2. Fuel hedges protect margins.
Bearish Case
Fuel costs up 15%. Recession cuts leisure travel.
Labor contracts pressure wages. Debt refinancing looms 2027.
Market Sentiment & Investor Psychology
Short interest elevated ~10%; puts lead calls slightly. Institutions own 60%, trimming positions.
Retail defensive after 2025 rally. Fearful sentiment dominates—value hunters circle.
Short-Term Outlook
Support $10.50 critical; RSI neutral eyes bounce. Volume drop favors pause.
Earnings reaction key; range-bound likely.
Medium to Long-Term Outlook
Network strength endures. Air travel grows 4% yearly.
Debt manageable if demand holds; competition fierce. Watchlist for capacity proof.
FAQ
Is AAL stock a buy right now?
Hold consensus; buy below $10.
What is the price target for AAL stock?
$15.72 median; $8-26 range.
What are major risks for AAL stock?
Fuel prices, recession.
AAL earnings outlook?
EPS improves on cuts.
AAL forecast 2026?
$15+ if travel rebounds.
Suggestions
- Compare with Opendoor stock analysis
- See our UAL airlines forecast
- Read our travel sector valuation
Conclusion
Watchlist AAL stock. Undervalued vs. peers, but fuel/debt risks demand caution.
Disclaimer: This article is for informational purposes only and not financial advice.