
OPEN stock forecast covers Opendoor Technologies price trends, real estate trends, earnings outlook, and valuation metrics. Is OPEN stock a buy in 2026 housing market?
Introduction
Opendoor Technologies (OPEN stock) is an iBuying platform that buys homes directly from sellers. It offers instant cash offers and handles renovations for quick resales.
Investors watch OPEN stock now as housing inventory tightens and mortgage rates stabilize around 6.5%. Real estate tech faces volatility from interest rate swings and buyer sentiment shifts.
Latest Stock Price & Trend
OPEN stock closed at $1.97 on March 6, 2026 (last market close data), down 2.48% from $2.02 prior day. Trading volume hit 12.3 million shares versus 8.5 million average.
Five-day trend mixed: +3.1% Monday bounce, -4.2% Tuesday pullback in $1.90-$2.10 range. One-month performance flat after February dip to $1.82 lows.
Three-month action reflects 15% decline from $2.35 December peaks amid slow spring buying season. Six-month down 28% from summer $2.75 highs.
Year-to-date 2026, OPEN stock lost 22% from January $2.53 start. 52-week range spans $1.82 low to $3.98 high showing depressed trading range.
Overall trend sideways-bearish with basing pattern. Investors see potential stabilization but need housing catalysts for upside conviction.
Technical Analysis
Support holds at $1.85-$1.90 matching 52-week lows and February test levels. Support shows where buyers consistently defend price floors.
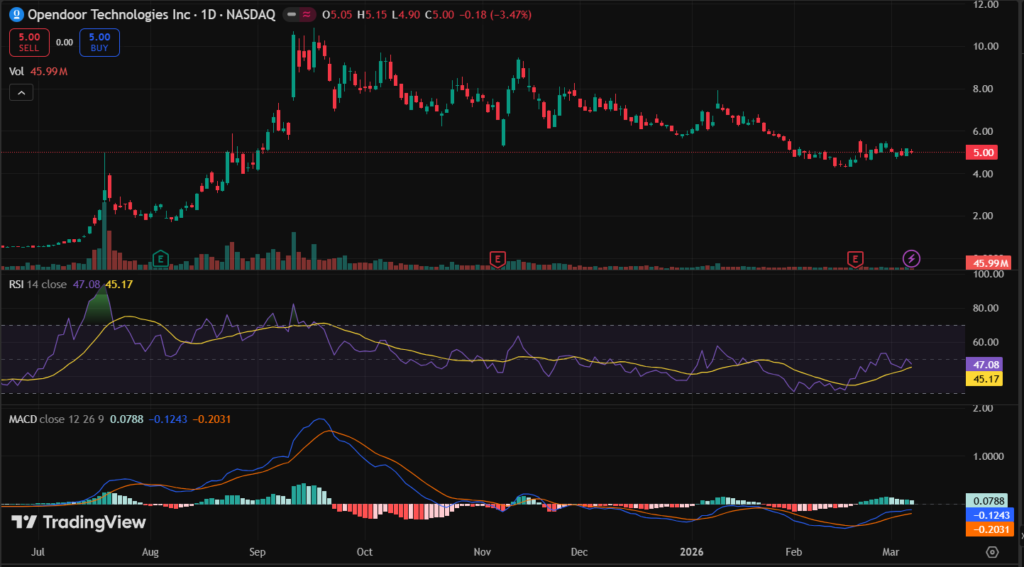
Resistance sits at $2.10-$2.25 prior consolidation zones and 50-day moving average overhead. Breaking resistance signals short-term momentum shift.
RSI neutral around 45 after recent consolidation, avoiding oversold extremes below 30. RSI measures buying/selling momentum for trade timing.
MACD flat near zero line lacking bullish crossover conviction. MACD tracks trend strength through moving average relationships.
50-day average $2.12 above price; 200-day $2.45 confirms downtrend intact. Volume steady but lacks breakout conviction above 15 million shares.
Analyst Ratings & Price Targets
15 analysts rate OPEN stock: 2 Buy, 9 Hold, 4 Sell consensus. Average price target $2.45 implies 24% upside from $1.97 close.
Highest target $4.00 from optimistic housing recovery views; lowest $1.50 reflects margin concerns. Recent Piper Sandler downgrade to Neutral at $2.25.
Wall Street mixed: JPMorgan Hold $2.00, Citi Sell $1.50 citing iBuying model risks. Hold consensus signals limited near-term catalysts for investors.
Insider Activity
CEO Carrie Wheeler sold 38K shares at $2.05 average in February per Form 4 filings. Routine planned sale, no distress pattern.
CFO and engineering execs trimmed smaller positions. Management owns meaningful equity; steady selling reflects diversification not panic.
Routine activity suggests operational confidence amid housing market uncertainty.
Valuation Analysis
Trailing P/E N/A (ongoing losses EPS -$0.56). Forward P/E -3.2x reflects negative 2026 estimates.
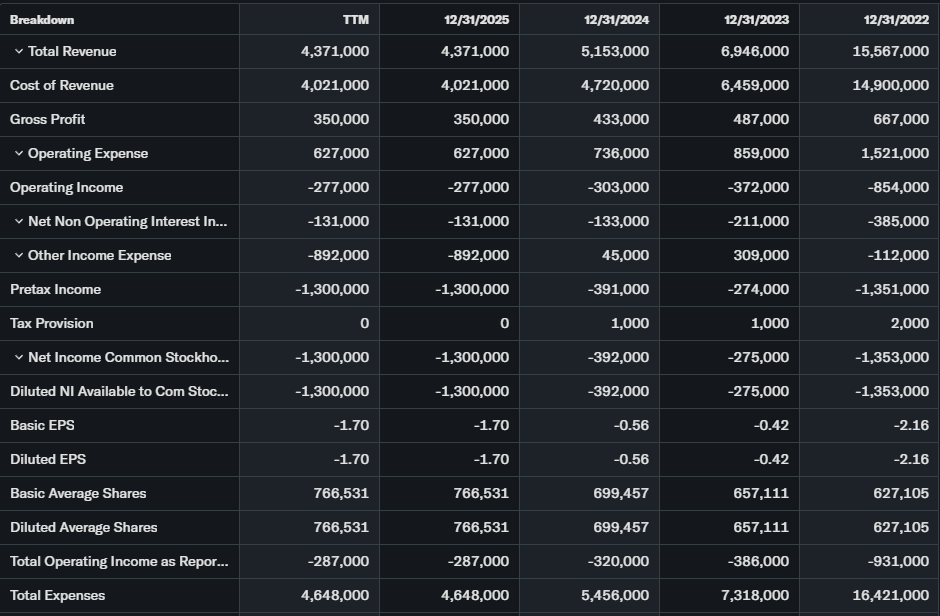
Price-to-sales 0.45x depressed versus real estate tech peers trading 2-4x sales. Revenue flat YoY at $5.9B TTM as transactions slowed.
Free cash flow negative -$120M quarterly burn. $630M cash vs $1.2B debt manageable leverage.
Compared to profitable Zillow (0.8x sales) or Redfin (0.6x sales), OPEN appears undervalued on revenue multiple but overvalued on cash burn trajectory.
Recent Earnings & Catalysts
Q4 2025 revenue $1.2B beat estimates but down 12% YoY on fewer homes bought. EPS -$0.16 vs -$0.12 expected (missed).
Q1 2026 guidance $1.0-1.1B revenue reflects seasonal slowdown. Next earnings May 6. Key catalysts: inventory build, rate cuts boosting transactions.
Earnings drove 8% initial drop fading to -2% as housing recovery hopes tempered guidance concerns.
Bullish Case
Mortgage rates falling toward 6% spark spring buying season. 0.45x sales cheapest among iBuyers creates re-rating opportunity.
Inventory shortages favor instant cash offer model. Cost cuts improve unit economics at scale.
Bearish Case
Housing affordability crisis persists at median $400K prices. iBuying loses to traditional agents on margins (2-3% vs 6%).
$120M quarterly cash burn threatens runway without profitability. Regulatory scrutiny on real estate tech grows.
Market Sentiment & Investor Psychology
Short interest 18.2% of float reflects bearish conviction. Puts dominate March $2.00 strikes showing downside protection demand.
Institutions trimmed 5% holdings last quarter; retail rotates on housing news. Sentiment fearful with value trap concerns: bearish bias.
Short-Term Outlook
Technicals test $1.90 support critical ahead housing data releases. Volume spike above 15M signals potential bounces.
$1.85-$2.15 range likely absent rate cut breakthroughs. Mortgage applications data drives sentiment swings.
Medium to Long-Term Outlook
iBuying model challenged but inventory crisis creates opportunity. Financial health hinges on cash preservation through downturn.
Rate normalization favors transaction volume recovery. Long-term investors: watch $1.80 support, avoid accumulation until profitability path clarifies.
FAQ
Is OPEN stock a buy right now?
Hold rating appropriate; $1.80 support offers better risk/reward entry.
What is the price target for OPEN stock?
Average $2.45 (24% upside); range $1.50-$4.00 analyst spread.
What are major risks for OPEN stock?
Cash burn, housing slowdown, iBuying margin compression, debt load.
OPEN earnings trends?
Revenue beats, EPS misses pattern; Q1 guidance seasonally soft.
OPEN long-term outlook?
Housing recovery catalyst needed for sustained upside.
Suggestions
Compare with Opendoor
See our Microsoft stock forecast for Azure real estate AI.
Read our proptech sector valuation breakdown.
Conclusion
Watchlist. OPEN stock trades depressed 0.45x sales amid housing woes, but $120M cash burn and iBuying model risks demand caution. $1.80 support defines risk level; May earnings critical pivot.
Disclaimer: This article is for informational purposes only and not financial advice.