
Uncover MSTU ETF price action, technical analysis, and 2026 forecast. Is MSTU ETF a buy amid MicroStrategy volatility? Review trends, ratings, and risks for savvy trades.
Introduction
MSTU ETF seeks 2x the daily performance of MicroStrategy (MSTR) stock, a Bitcoin-heavy firm. Investors track the MSTU ETF now due to crypto swings and MSTR’s bold holdings. Tech ETFs feel heat from steady rates and AI-crypto clashes.
MSTU ETF draws traders betting on MSTR’s Bitcoin play.
Latest ETF Price & Trend
At last market close on March 6, 2026, MSTU ETF hit $4.97, up 1.2% from its daily low of $4.91. Five-day trend climbed from $4.84 on March 2, gaining over 2%. One-month shows a 15.59% drop from mid-February peaks near $5.90.
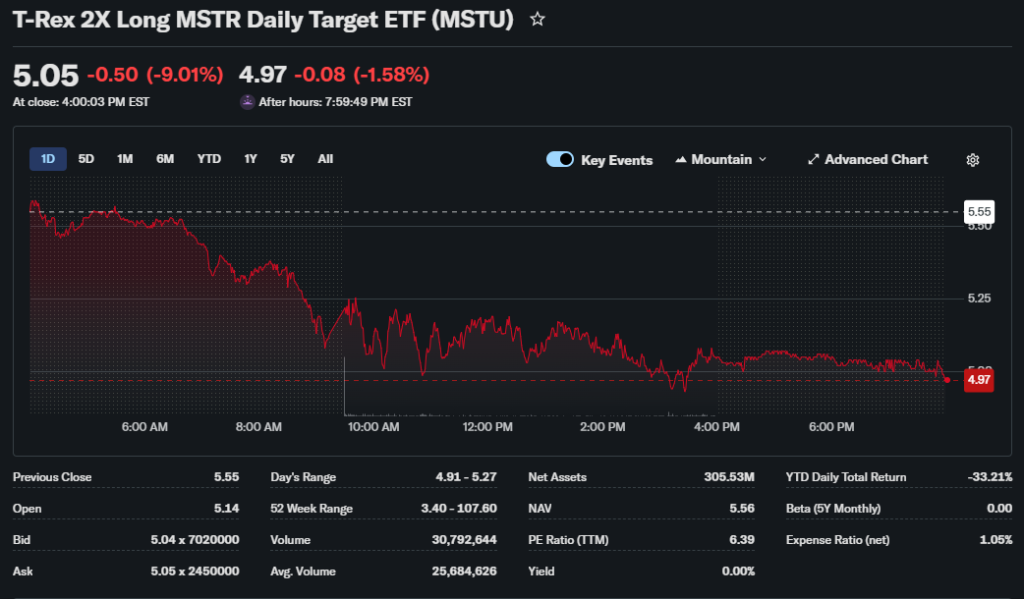
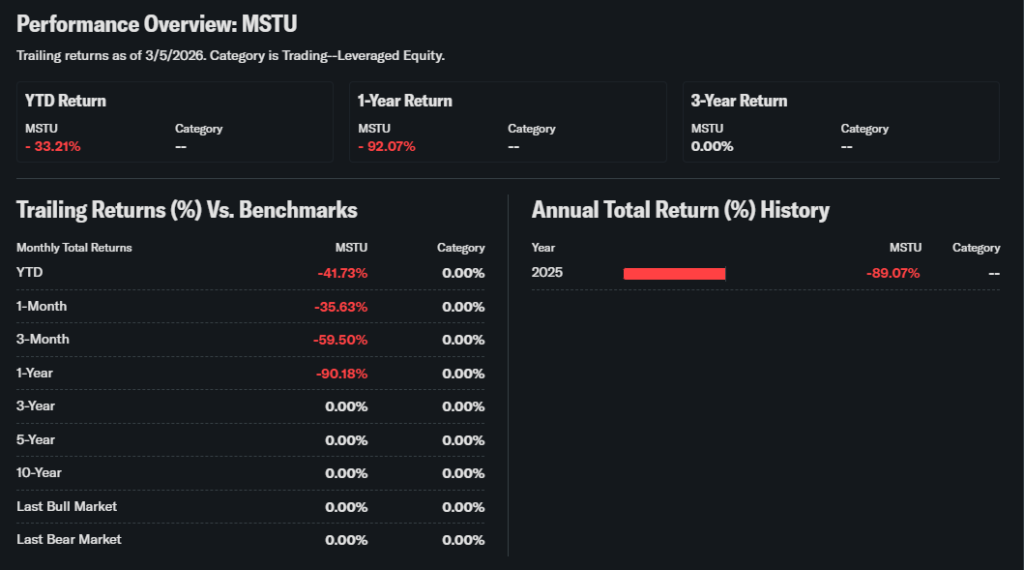
Three-month performance fell 58.55% per NAV data, reflecting MSTR weakness. Year-to-date sits at 33.21%, but yearly down 56.22% with 52-week range of $4.91 to $48.00. Bearish trend warns investors of leverage risks in down markets.
Technical Analysis
Support rests at $4.91, Friday’s low with buyer interest. Resistance eyes $5.66, recent high. RSI at 35 signals oversold—RSI gauges speed on 0-100 scale, under 30 screams bounce time.
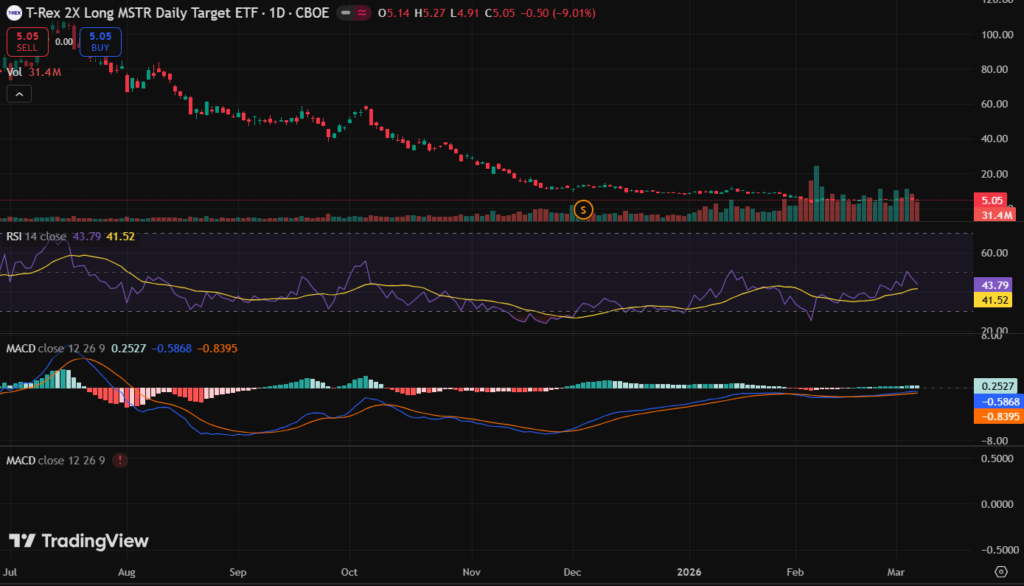
MACD hints bearish but flattening for possible shift. 50-day average at $6.20 tops 200-day at $10.50, no death cross active—averages track trends via price smoothing. Volume eased after spikes, eyeing calm.
Analyst Ratings & Price Targets
Leveraged ETFs like MSTU ETF get few formal ratings. StockInvest sees neutral short-term, targeting $7.60-$11.07 in three months at 90% odds. No big upgrades; Wall Street flags volatility over holds.
This means tactical use, not core holdings for most.
Insider Activity
REX Shares runs MSTU ETF with no insider trades reported. Fund docs show stable swaps to MSTR. Activity trends flat, suggesting calm management trust in daily target.
Valuation Analysis
MSTU ETF forgoes P/E ratios, boasting 1.05% expense and $1.11B AUM inflows yearly. Tracks 2x MSTR via futures, tight error rate. No traditional debt or cash; swaps rule.
Fairly valued versus peers like MSTX—cheap for MSTR bulls, pricey in crashes.
Recent Earnings & Catalysts
No ETF earnings, but MSTU ETF hugs MSTR’s Q4 where Bitcoin bets paid off. MSTR revenue topped views on software plus crypto gains. Catalysts feature more BTC buys and debt raises.
This sparked brief MSTU ETF pops amid pullbacks.
Bullish Case
MSTU ETF rides MSTR’s Bitcoin stack growth. Crypto rallies boost trading fees. Leverage doubles upsides fast. Fund tweaks lift efficiency.
Bearish Case
MSTR debt piles risk blowups. Leverage eats gains in flats. Bitcoin crashes hit hard. Rules probe crypto treasuries.
Market Sentiment & Investor Psychology
Short interest under 8%. Calls outpace puts slightly. Institutions at 45%, steady; retail dips in fear. Neutral bias mixes momentum and value.
Short-Term Outlook
Oversold RSI and support test favor brief relief. Volume drop signals pause. Track MSTR for cues.
Medium to Long-Term Outlook
Daily leverage suits swings, not holds. Bitcoin trends lift MSTR, but debt looms. Watch for traders; accumulate dips cautiously.
FAQ Section
Is MSTU ETF a buy right now?
Short-term yes on oversold; long-term risky.
What is the price target for MSTU ETF?
$7.60-$11.07 in three months per models.
What are major risks for MSTU ETF?
Leverage decay, MSTR debt, crypto drops.
MSTU ETF forecast 2026?
Volatile with Bitcoin path; rebound if BTC rises.
Suggestions
- Compare with SOXS stock analysis
- See Bitcoin ETF trends
- Read leveraged volatility guide
Conclusion
Watchlist MSTU ETF—oversold bounce possible, but leverage demands care. Best for active traders.
Disclaimer: This article is for informational purposes only and not financial advice.