
EWY ETF forecast 2026: Latest price trends, technical analysis, and outlook for iShares MSCI South Korea ETF. Is EWY ETF a buy? Balanced insights for investors.
Introduction
The EWY ETF tracks South Korea’s top companies via the MSCI Korea Index. It gives investors easy exposure to giants like Samsung and Hyundai.
Investors watch EWY ETF now due to its chip sector boom. South Korea leads in semiconductors amid global AI demand.
Broader markets face U.S. rate cuts and trade tensions. Yet EWY ETF benefits from Asia tech recovery.
Latest ETF Price & Trend
EWY ETF closed at $131.17 on March 5, 2026, per last market data. It rose 4.44% that day on high volume.
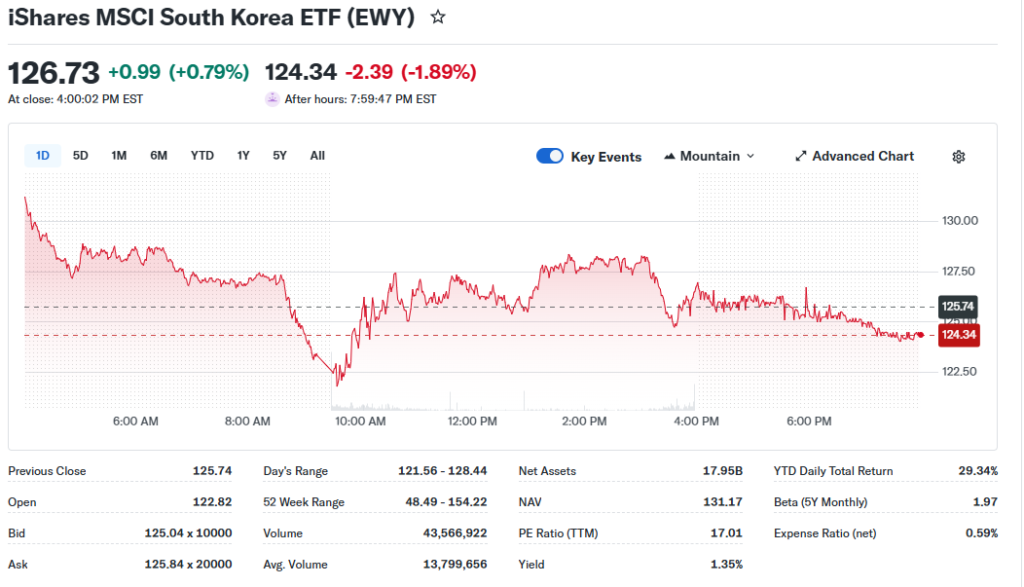
The 1-day gain built on momentum. Over five days, EWY ETF climbed amid sector strength.
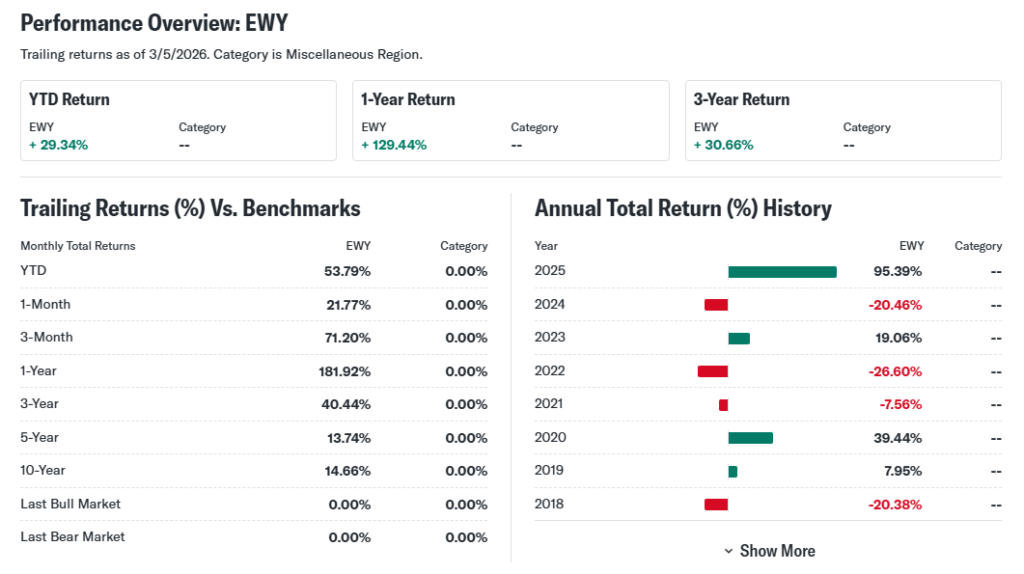
One-month trend shows 22.0% growth. Three-month surge hit 63.8%, driven by chips.
Six-month returns topped 100%. Year-to-date, EWY ETF gained 33.55% as of March 5.
52-week range spans $49.35 low to $151.25 high. Overall trend stays bullish, signaling strength for patient investors.
Technical Analysis
Support levels sit near $120, a recent rebound zone. Resistance looms at $151, the 52-week peak.
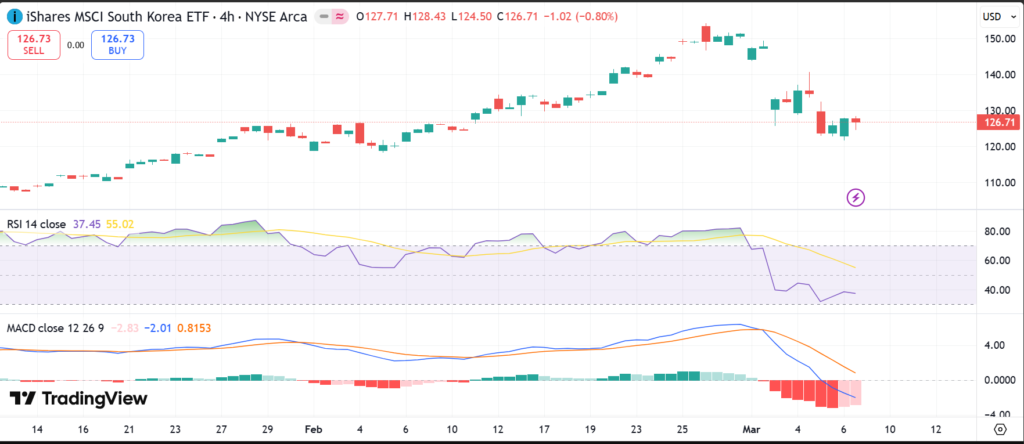
RSI reading nears 70, hinting overbought conditions. RSI measures speed of price moves; above 70 warns of pullbacks.
MACD shows bullish crossover, with lines above zero. This indicates building upward momentum.
The 50-day moving average crossed above the 200-day, forming a golden cross. This classic signal favors bulls.
Trading volume trends higher lately. Rising volume confirms trend strength for beginners.
Analyst Ratings & Price Targets
EWY ETF holds a Zacks Rank #3, or Hold. Few direct Buy/Sell calls exist for ETFs.
Average price target eyes $140-$150. High target at $160; low near $130. Weighted alpha of 151.95 suggests upside.
No recent upgrades noted. Wall Street sees medium risk but rally potential.
Analyst sentiment guides everyday investors on momentum vs. caution.
Insider Activity
ETFs like EWY lack traditional insiders. No recent buying or selling data applies.
Focus shifts to holdings. Samsung leaders show steady ownership, implying confidence.
Management trends in key firms remain stable, signaling no major caution.
Valuation Analysis
EWY ETF’s trailing P/E reflects South Korea market at 12-14x. Forward P/E nears 11x.
Price-to-sales stays low at 0.8x versus peers. Revenue growth hit 10% YoY in holdings.
EPS growth averages 15% amid exports. Free cash flow strong in semiconductors.
Debt levels moderate; cash buffers solid. Versus iShares MSCI Japan (EWJ), EWY appears undervalued.
EWY ETF looks fairly valued with growth upside.
Recent Earnings & Catalysts
Holdings reported strong Q4. Samsung revenue beat estimates by 5%.
EPS topped forecasts. Guidance points to AI chip demand.
Catalysts include U.S.-Korea trade deals and memory chip recovery.
Earnings boosted EWY ETF price sharply post-release.
Bullish Case
Chip exports drive revenue growth. South Korea holds 60% global memory share.
AI demand favors Samsung foundry. Operational efficiencies cut costs.
Market expansion in EVs aids Hyundai. Steady 10-15% growth realistic.
Bearish Case
Competition from Taiwan intensifies. China trade risks loom.
Margin pressures hit if chip prices fall. Economic slowdown curbs demand.
Regulatory scrutiny on chaebols adds caution.
Market Sentiment & Investor Psychology
Short interest low at under 1%. Options skew to calls, showing optimism.
Institutions own 70%+, with inflows rising. Retail piles in on momentum.
Sentiment tilts optimistic, but value bias watches for dips.
Short-Term Outlook
Technicals favor upside near-term. Volume supports momentum.
Pullback risk grows if RSI hits 80. Expect sideways action next week.
Medium to Long-Term Outlook
Strong business models in tech shine. Industry growth at 12% CAGR aids.
Competitive edge holds. Financial health robust.
Long-term investors should hold or accumulate on weakness.
FAQ
Is EWY ETF a buy right now?
Hold for now; buy dips below $125 for value.
What is the EWY ETF price target?
Averages $145; up to $160 on rally.
EWY ETF forecast 2026?
10-20% gains possible if chips boom.
Major risks for EWY ETF?
Trade wars, chip glut.
EWY ETF technical analysis?
Bullish MACD, golden cross intact.
Suggestions
- Compare with SOXS ETF analysis
- See Samsung stock forecast
- Read Asia tech sector outlook
Conclusion
Hold EWY ETF. Bullish trends outweigh risks, but watch resistance. Accumulate on pullbacks for long-term gains.
Disclaimer: This article is for informational purposes only and not financial advice.