Explore NVD ETF price, technical analysis, forecast, and if NVD ETF is a buy. GraniteShares 2x Short NVDA Daily ETF analysis with trends and ratings for investors.
Introduction
The NVD ETF tracks -2x the daily performance of NVIDIA stock, less fees. It lets investors bet against NVDA’s daily moves. Everyday folks eye it now as NVDA hits highs in AI boom.
Tech ETFs face volatility from rate cuts and chip demand. Broader markets stay bullish on semis. NVD ETF draws attention amid NVDA’s rally.
Latest ETF Price & Trend
NVD ETF closed at $9.40 on last market data, up 0.32% that day. Day’s range hit $9.29 to $9.64. 1-day gain was small amid high volume of 32 million shares.
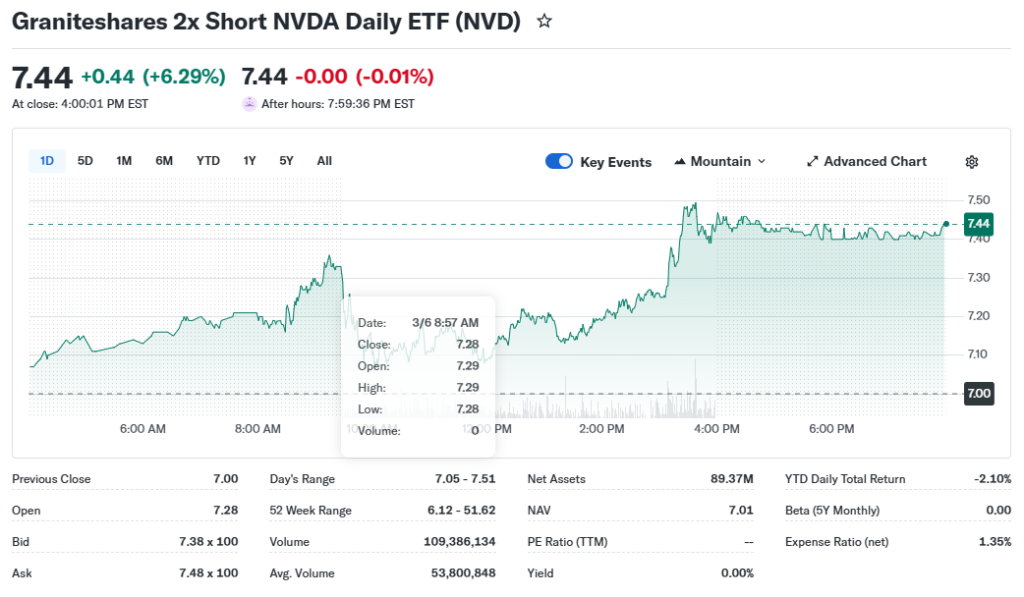
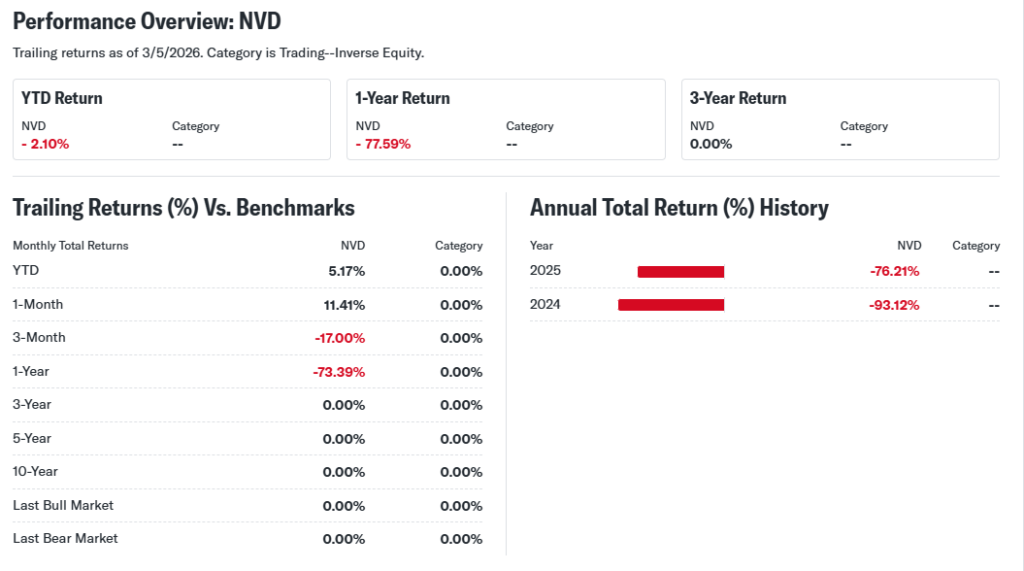
5-day trend shows stability near $9. 1-month up 4.30%, but 3-month down 38.39%. 6-month drop stands at 59.69%, YTD loss 61.56%.
52-week high reached $64.50, low $9.16. Overall trend looks bearish long-term due to NVDA strength. Investors see it as a hedge tool, not buy-and-hold. Short-term holds steady.
Technical Analysis
Support levels sit at $6.08, a key floor if price dips. Resistance looms at $7.69; break above signals upside. These levels matter as they show where buyers or sellers step in.
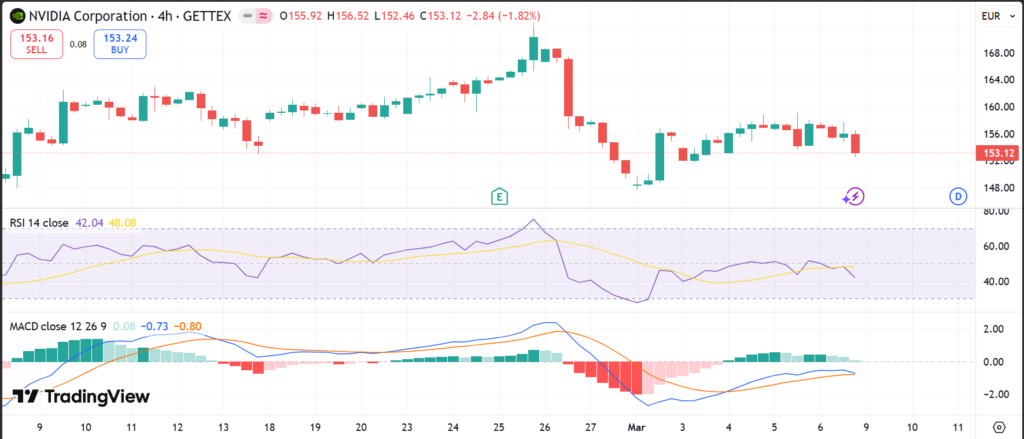
RSI reads 49.55, neutral—not overbought or oversold. MACD at -0.05 gives sell signal for momentum. RSI measures speed of price changes; over 70 means too hot, under 30 too cold.
50-day moving average around recent lows; 200-day at $9.77, price below both. No golden cross (bullish 50-day over 200-day). Volume trends high at 109 million lately vs average 88 million. High volume confirms moves.
Analyst Ratings & Price Targets
Few traditional ratings exist for leveraged ETFs like NVD ETF. Seeking Alpha shows mixed views from very bullish to bearish. No Wall Street consensus targets noted.
Upgrades or downgrades rare for daily inverse funds. Sentiment leans cautious as tools for tactics. Investors use ratings to gauge pro views on NVDA bets.
Insider Activity
NVD ETF lacks traditional insiders as it’s managed by GraniteShares. No recent buying or selling data applies. Management activity not tracked like stocks.
This implies neutral confidence; focus stays on NVDA trends. No red flags from trades.
Valuation Analysis
Leveraged ETFs like NVD ETF skip standard P/E or EPS. Expense ratio is 1.50%. AUM at $178.28 million.
Dividend yield hits 27.76% TTM, payout annual. No debt or cash position like stocks. Compare to NVDL (long version): NVD inverse makes it volatile.
NVD ETF appears fairly valued as tactical play, not undervalued stock.
Recent Earnings & Catalysts
ETFs report no quarterly earnings. Performance ties to NVDA results. NVDA’s latest beat expectations, boosting its stock.
No forward guidance for NVD ETF. Catalysts include NVDA AI news or pullbacks. NVDA strength hurts NVD ETF performance.
Bullish Case
NVD ETF gains if NVDA drops daily. Demand rises on NVDA overheat or corrections. High short interest in NVDA could help.
Tech pullbacks from valuations aid inverse plays. Operational resets monthly keep it fresh. Steady volume supports liquidity.
Bearish Case
NVDA’s AI lead crushes NVD ETF in rallies. Long-term decay from daily reset hurts holds. Competition from other shorts like NVDS.
Margin from fees at 1.50% eats gains. Economic strength boosts NVDA, risks NVD. Regulatory swaps scrutiny possible.
Market Sentiment & Investor Psychology
Short interest data sparse for ETFs. Options show high activity on NVDA, indirect for NVD. Institutional ownership via swaps.
Retail piles into NVDA longs, sidelining shorts. Sentiment neutral to optimistic on NVDA, fearful for NVD ETF. Momentum favors longs.
Short-Term Outlook
Technicals show neutral RSI, sell MACD. Volume up suggests moves if NVDA dips. Momentum from NVDA earnings key.
Expect sideways unless NVDA shifts. Watch support at $6-9. Realistic hold near current levels.
Medium to Long-Term Outlook
Daily leverage suits not long holds due to compounding loss. NVDA growth strong in AI. NVD ETF fits hedges.
Financial health solid with $178M AUM. Watch NVDA dominance, risks from volatility. Long-term investors should watch, not accumulate.
FAQ Section
Is NVD ETF a buy right now?
No strong buy case; best as short-term hedge on NVDA dips.
What is the price target for NVD ETF?
No consensus targets; depends on NVDA path.
What are major risks for NVD ETF?
Decay from resets, NVDA rallies, high fees.
NVD ETF forecast?
Bearish if NVDA rises; volatile short-term.
Suggestions
- Compare with SOXS ETF analysis
- See NVDA stock forecast
- Read tech leveraged ETF guide
Conclusion
Watch NVD ETF for NVDA hedges. Strong NVDA trends limit upside; use tactically. Balanced view favors hold or watchlist over buy.
Disclaimer: This article is for informational purposes only and not financial advice.