
Explore TQQQ ETF price trends, technical analysis, analyst ratings, and 2026 forecast. Is TQQQ ETF a buy amid Nasdaq volatility? Get balanced insights for investors.
Introduction
TQQQ ETF seeks daily investment results that correspond to three times (3x) the daily performance of the NASDAQ-100 Index.
Investors watch TQQQ ETF closely now due to leveraged exposure to tech giants like Apple and Nvidia.
Broader market conditions, including tech sector swings and interest rate shifts, impact TQQQ ETF price heavily.
Latest ETF Price & Trend
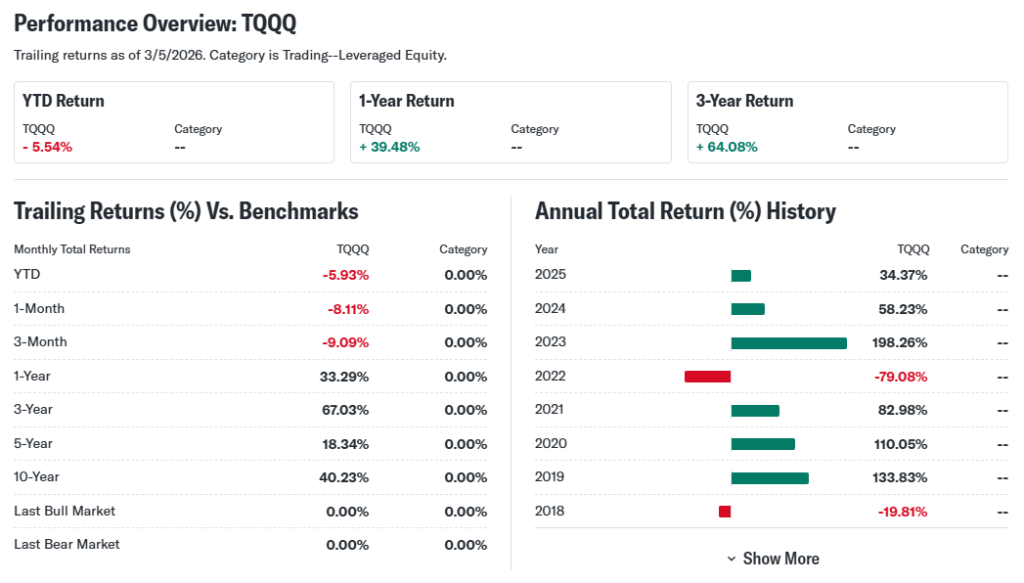
As of the last market close on March 6, 2026, TQQQ ETF traded at around $49.80.
The ETF saw a 1-day dip amid Nasdaq pullback, with recent sessions showing volatility from 48.17 to 50.76.
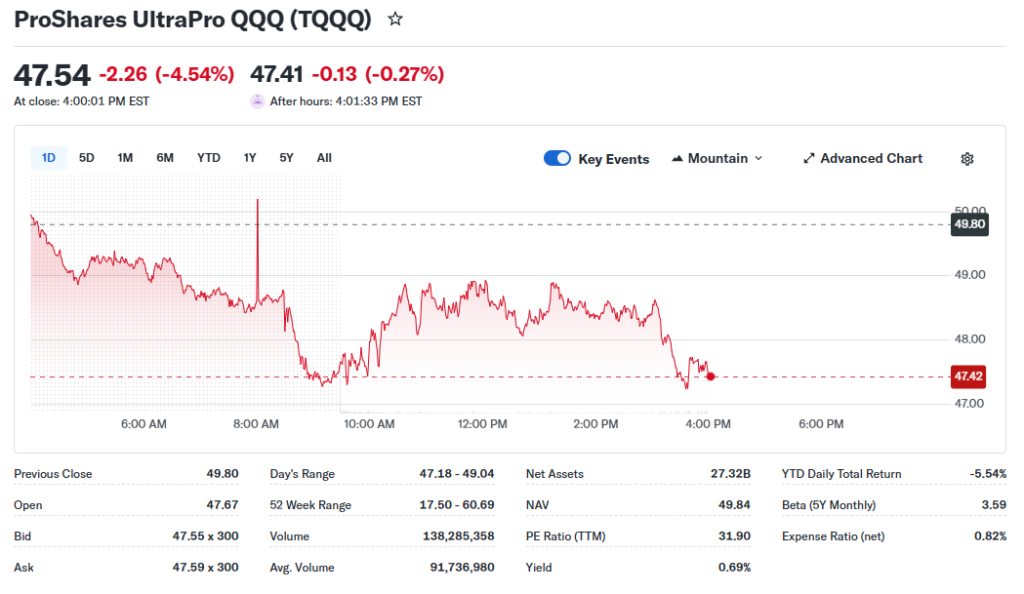
Over five days, TQQQ ETF trended down slightly as tech stocks cooled; the 1-month change sits at -6.48% from a high of $52.50.
In three months, it dropped 15.74% from $58.01 peak, yet six-month gains hit +38.97% from $35 lows.
Year-to-date, TQQQ ETF is up 18.39%, with 52-week range from $17.50 low to $60.69 high.
The overall trend leans bullish long-term but sideways short-term, signaling caution for near-term investors amid leverage decay risks.
Technical Analysis
Support levels mark prices where TQQQ ETF may bounce, like $46.25; resistance caps upside at $52.50.
RSI at 48.71 shows neutral momentum, neither overbought (above 70) nor oversold (below 30), helping spot exhaustion.
MACD at -0.86 signals short-term sell, as this oscillator tracks trend changes via moving average crossovers.
The 50-day moving average hovers near $49.46, above the 200-day at $48.27, avoiding a death cross for now.
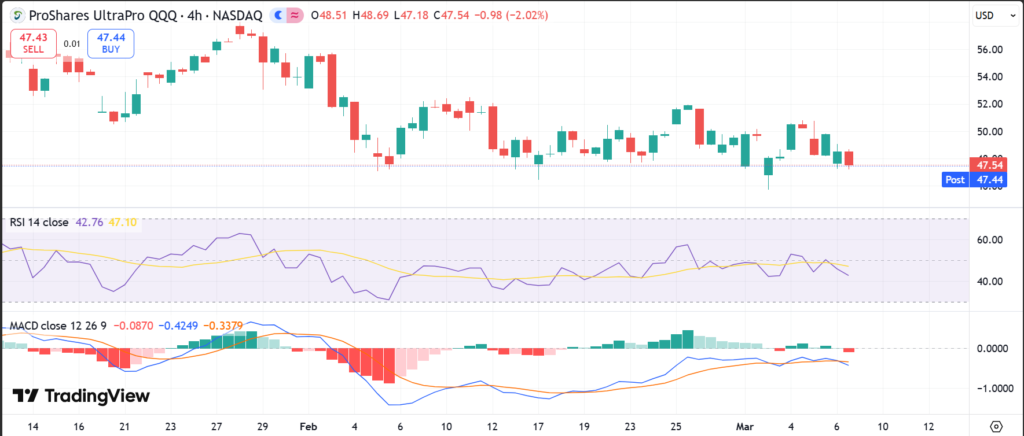
No golden cross recently, but trading volume averages 83 million shares daily, up lately, indicating active interest.
Analyst Ratings & Price Targets
Holdings in TQQQ ETF earn a Moderate Buy aggregate rating from 533 analyst views on 14 key companies.
Average price target stands at $110.56, with high and low both at that level for covered holdings.
Recent ratings from Goldman Sachs and Deutsche Bank lean hold, reflecting Nasdaq caution.
This sentiment suggests upside potential if tech rebounds, but investors should weigh leverage risks.
Insider Activity
TQQQ ETF, as a fund, reports no direct insider trades since managers track index holdings.
Institutional ownership trends show increases, like Howard Capital up 83.6% to 8.5 million shares.
No large recent buys or sells noted, implying steady confidence from big players.
Valuation Analysis
TQQQ ETF lacks traditional P/E as a leveraged fund; focus on underlying Nasdaq-100 multiples around 30x forward.
Price-to-sales for holdings averages high due to tech growth, with YoY revenue up in sector.
EPS growth strong in components like Nvidia, but leverage amplifies volatility over free cash flow metrics.
Compared to unleveraged QQQ, TQQQ appears fairly valued for aggressive traders, not overvalued yet.
Recent Earnings & Catalysts
TQQQ ETF reports no company earnings; performance ties to daily Nasdaq-100 resets.
Recent Nasdaq earnings from holdings beat expectations, boosting TQQQ briefly before pullbacks.
Catalysts include AI demand and tech partnerships, with forward guidance positive for index.
Earnings momentum lifted TQQQ year-to-date but faded in recent months.
Bullish Case
Tech sector demand fuels Nasdaq-100, tripling gains for TQQQ ETF in uptrends.
AI integrations in holdings like Microsoft drive revenue growth catalysts.
Operational efficiencies in index firms support long-term upside.
Bearish Case
Leverage causes decay in sideways markets, eroding TQQQ ETF value over time.
Competition in tech and margin pressures from rates hit performance.
Regulatory scrutiny on big tech adds economic risks.
Market Sentiment & Investor Psychology
Short interest at 3.4-5.73% of float shows mild bearishness, with days-to-cover at 0.2.
Options activity near neutral with put/call ratio 0.91; calls slightly favored.
Institutions boost ownership; retail chases momentum in tech rallies.
Sentiment tilts optimistic long-term, neutral short-term.
Short-Term Outlook
Technical indicators like neutral RSI and sell MACD point to consolidation.
Volume trends steady, market momentum tied to Nasdaq support at $46.
Expect sideways action unless tech news shifts volume higher.
Medium to Long-Term Outlook
TQQQ ETF thrives on Nasdaq growth from tech dominance.
Industry expansion in AI bolsters position, despite volatility.
Financial health solid via swaps; hold for bull markets, watch in bears.
FAQ Section
Is TQQQ ETF a buy right now?
Moderate Buy rating, but high risk for short-term due to leverage.
What is the price target for TQQQ ETF?
Aggregate $110.56 from holdings analysis.
What are major risks for TQQQ ETF?
Leverage decay, market downturns amplify losses.
TQQQ forecast for 2026?
3-month potential +49.88% to $127 range.
TQQQ technical analysis summary?
Neutral RSI, trading above key MAs.
Suggestions
Compare with SOXS ETF analysis
See our SOXL ETF forecast
Read our Nasdaq tech sector breakdown
Conclusion
Watchlist TQQQ ETF for now. Upside exists in tech rallies, but leverage suits experienced traders only amid volatility.
Disclaimer: This article is for informational purposes only and not financial advice.