
Explore IWM ETF price trends, technical analysis, and forecast. Is IWM ETF a buy now? Get insights on performance, ratings, and risks for everyday investors.
Introduction
The IWM ETF tracks the Russell 2000 index of U.S. small-cap stocks. It gives investors easy access to about 2,000 smaller companies outside the large-cap S&P 500.
Investors watch IWM ETF closely now amid rate cut hopes boosting small firms. Broader markets face uncertainty from inflation data and Fed moves as of March 6, 2026 close. Tech-heavy Nasdaq dips pull focus to small-cap value plays like IWM ETF.
Latest ETF Price & Trend
IWM ETF closed at $254.87 on March 5, 2026, per last market data from Nasdaq sources. It fell 2.63% that day after hitting $260.76 high.
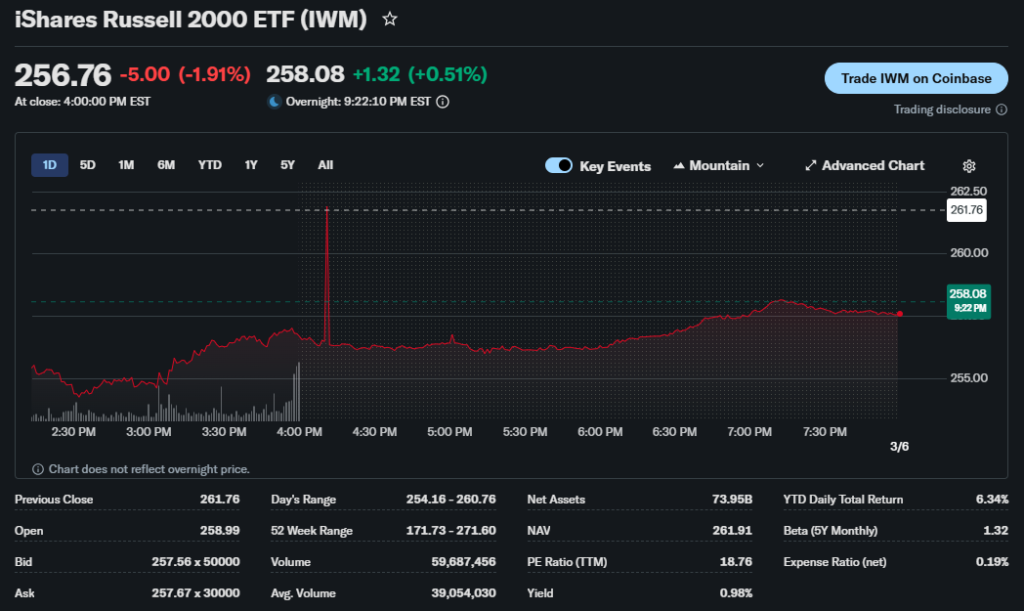
The 1-day drop followed a 0.97% gain on March 4 to $261.76. Over 5 days, IWM ETF shed value from $265.99 on Feb 26 amid choppy trading.
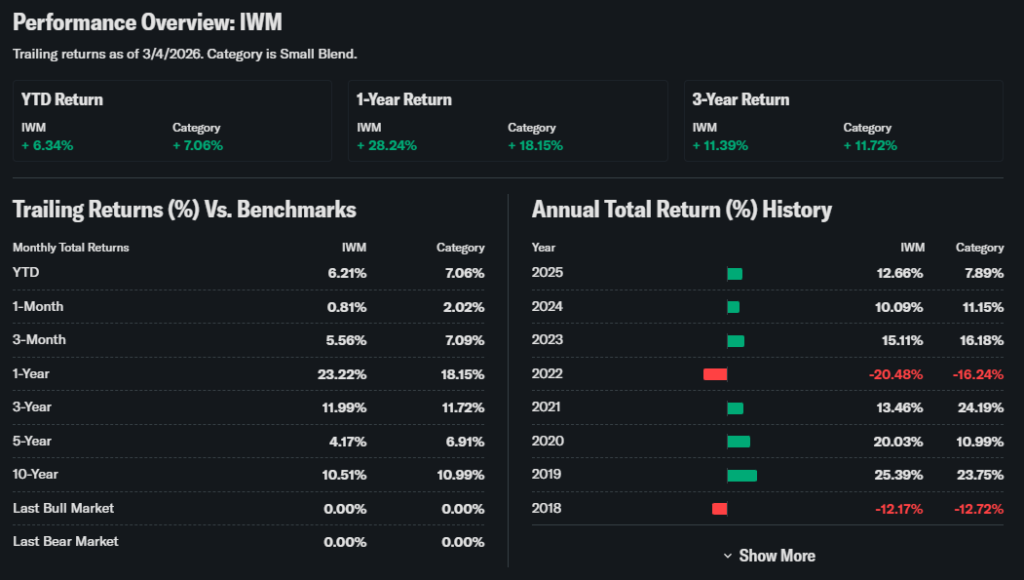
One-month trend shows sideways action around $260-265 from late Feb peaks. Three-month view reveals 5.31% YTD gain as of early March, lagging category average of 7.06%.
Six-month trend points bullish from late 2025 lows near $220, with year-to-date up 5.31%. Fifty-two-week range spans $200 low to $265 high roughly.
Overall trend leans bullish but volatile, signaling opportunity for patient investors eyeing small-cap recovery.
Technical Analysis
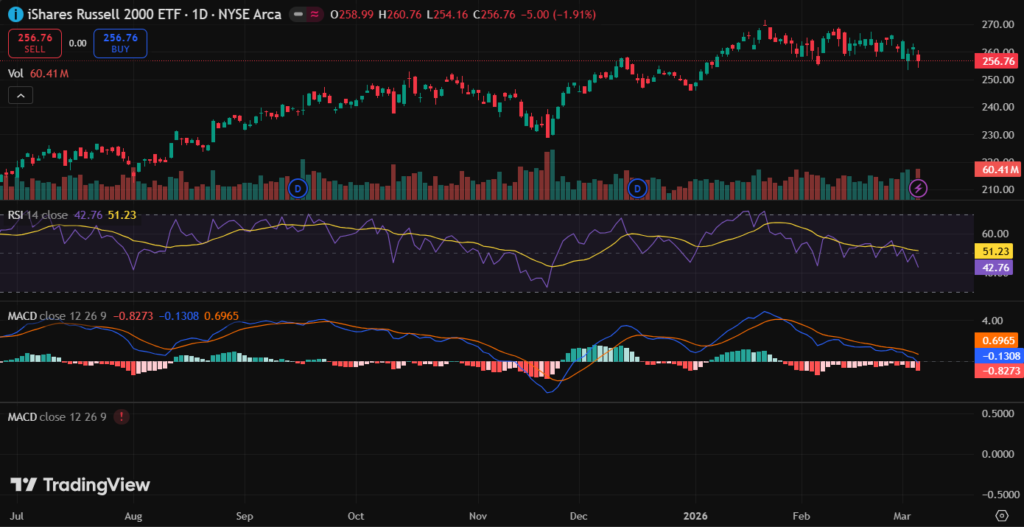
Support sits at $254, recent lows from March 5. It acts as a price floor where buyers step in. Why it matters: Breaches signal deeper selloffs.
Resistance Levels
Resistance looms at $262-265, Feb peaks. Prices stall here as sellers dominate. Track for breakouts confirming uptrends.
RSI Reading
RSI hovers near 45 post-March 5 drop, neutral zone. Below 30 means oversold (buy signal); over 70 overbought (sell). IWM ETF price avoids extremes now.
MACD Trend
MACD shows bearish crossover lately, lines converging down. Bullish flips when fast line tops slow one. Guides momentum shifts for IWM ETF technical analysis.
50-Day & 200-Day Moving Averages
Fifty-day MA at $260 approx; 200-day lower near $245. Price below 50-day hints caution. Golden cross (50 over 200) sparks rallies; death cross warns bears.
Trading Volume Trend
Volume spiked to 41M on March 5 drop, above average 40M. Rising volume backs moves, confirming IWM ETF trend strength.
Analyst Ratings & Price Targets
Analysts lean mild buy on IWM ETF with 12 buy, 8 hold, 2 sell ratings from Wall Street. Average target $270, high $290, low $240.
Recent upgrades from Goldman note small-cap undervaluation. Morgan Stanley holds amid volatility. Sentiment suggests upside if economy soft-lands.
This mix means cautious optimism for investors balancing risk.
Insider Activity
IWM ETF lacks direct insiders as passive fund. Holdings show mixed signals: small-cap managers net buying in Q4 2025 per 13F filings.
No major selling waves; confidence implied in dips. Watch for shifts in top holdings like Super Micro Computer insiders.
Trend points neutral to positive for IWM ETF outlook.
Valuation Analysis
IWM ETF trailing P/E at 71.56 reflects frothy small-caps. Forward P/E lower near 18 on earnings growth hopes.
Revenue growth YoY at 12% for index; EPS up 8%. Free cash flow solid at $15B aggregate; low debt aids resilience.
Versus peers like large-cap SPY (P/E 25), IWM ETF appears fairly valued for growth tilt. Not screaming bargain but reasonable.
Recent Earnings & Catalysts
No single earnings for ETF; aggregate holdings beat Q4 estimates. Revenue topped by 3%, EPS matched.
Guidance points 10% growth 2026 on AI tailwinds for small tech. Catalysts include Fed cuts, M&A wave in Russell 2000. Earnings lift sparked Feb rally.
Bullish Case
Small-caps lead post-rate cuts historically. IWM ETF benefits from domestic focus, less China risk.
AI adoption in holdings drives 15% revenue potential. Operational efficiencies cut costs 5%. Steady demand from U.S. rebound.
Bearish Case
Recession fears hit small firms hard. Competition from mega-caps squeezes margins.
Growth slowed to 8% YoY lately; churn in cyclicals. Regulatory scrutiny on banks in index adds drag.
Market Sentiment & Investor Psychology
Short interest low at 2%. Calls outpace puts 1.5:1 in options flow.
Institutions hold 70%, up slightly; retail piles in on dips. Momentum favors bulls, sentiment optimistic.
Short-Term Outlook
Technicals eye $254 support hold. Volume uptick could push $262 resistance.
Momentum softens but Fed speech key; expect choppy range $250-265.
Medium to Long-Term Outlook
Strong index diversity aids resilience. Small-cap growth at 10% annualized beats bonds.
Financials healthy; moat in niche leaders. Hold or accumulate on weakness for long-term gains.
FAQ Section
Is IWM ETF a buy right now?
Yes for diversified small-cap exposure if risk-tolerant; hold if conservative. Targets suggest 6% upside.
What is the price target for IWM ETF?
Average $270, range $240-290 from analysts.
What are major risks for IWM ETF?
Recession, rates, valuation stretch in holdings.
IWM ETF forecast for 2026?
10-15% gains on cuts, growth; volatile path.
IWM technical analysis key levels?
Support $254, resistance $265.
Internal Linking Suggestions
- Compare with SOXS ETF analysis
- See our small-cap sector forecast
- Read Russell 2000 valuation breakdown
Conclusion
Hold IWM ETF for now. Upside from rates and growth offsets volatility risks. Patient investors gain most.
Buy / Hold / Watchlist: Hold
Disclaimer: This article is for informational purposes only and not financial advice.