
QQQ ETF forecast 2026: Analyze price trends, technicals, and valuation for Invesco QQQ ETF. Is QQQ ETF a buy amid tech volatility? Latest data and outlook.
Introduction
The QQQ ETF tracks the Nasdaq-100 Index, focusing on top non-financial tech giants like Apple, Microsoft, and Nvidia. Investors watch QQQ ETF closely now due to AI boom and rate cut hopes in 2026. Broader market volatility from inflation data hits tech-heavy QQQ ETF hard.
Tech ETFs like QQQ ETF face pressure from high valuations amid shifting Fed policy.
Latest ETF Price & Trend
As of last market close on March 5, 2026, QQQ ETF price stands at around $607.45, down slightly from recent highs. The 1-day performance shows a minor dip of 0.15% from March 4 levels near $612.88.
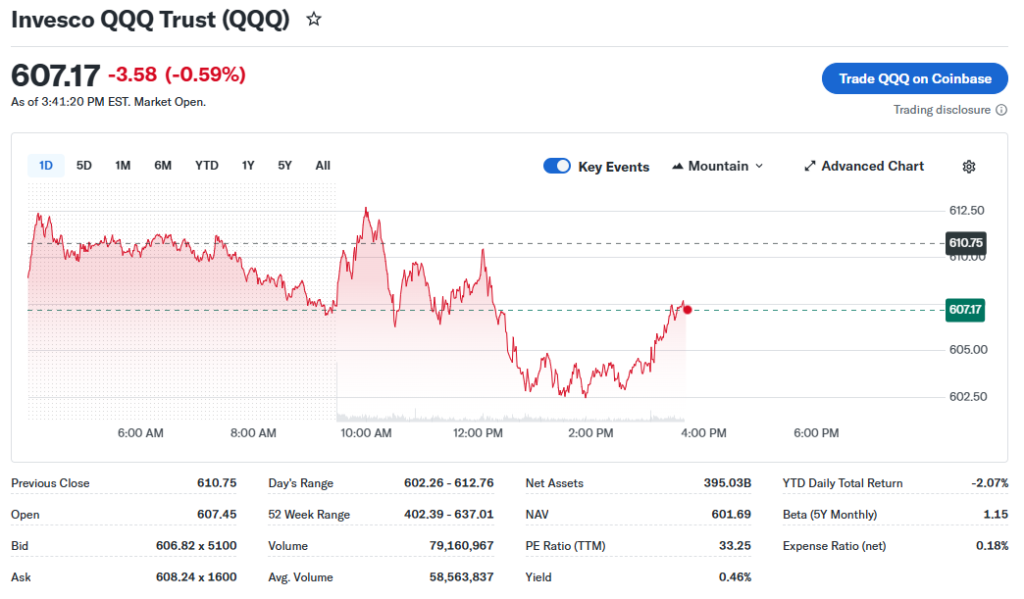
Over 5 days, QQQ ETF eased 0.92% from February 26 open, with a low of $591.87 on March 3. In the past month, it gained 1.89%, peaking at $617.52 on February 11. Three-month trend reflects a 2.74% drop from December 5’s $625.48, signaling short-term caution.
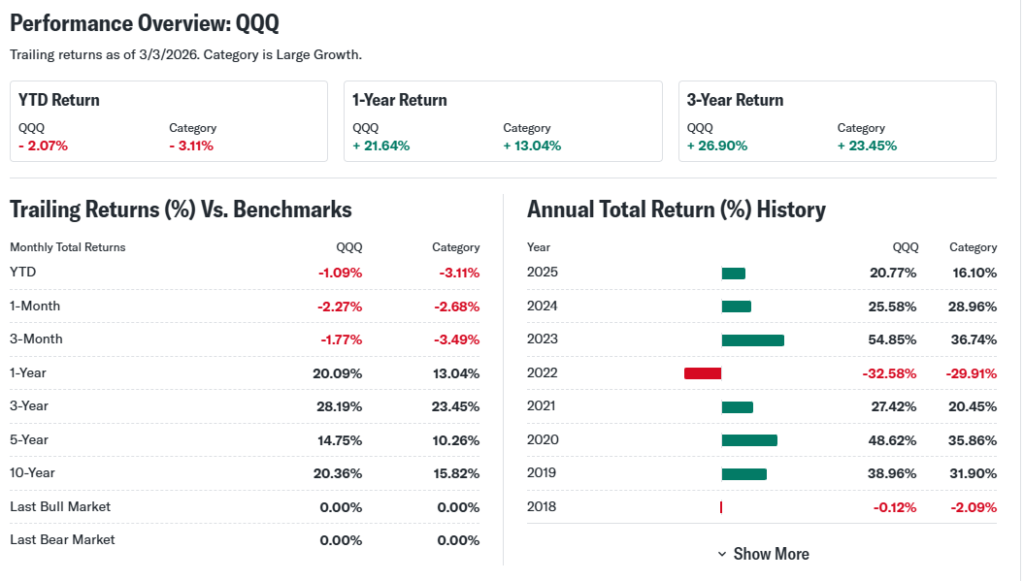
Six-month gains hit 5.60% from September 5, while year-to-date it’s down 0.98% from December 31. The 52-week range spans $402.39 low to $637.01 high, up 21.18% overall. This sideways-to-bullish trend suggests resilience for long-term investors but warns of near-term pullbacks in QQQ ETF price.
Technical Analysis
Support levels mark prices where QQQ ETF tends to bounce, like $591 near recent lows; they act as floors buyers defend. Resistance levels cap upside, around $612-$617 from March peaks, where sellers step in.
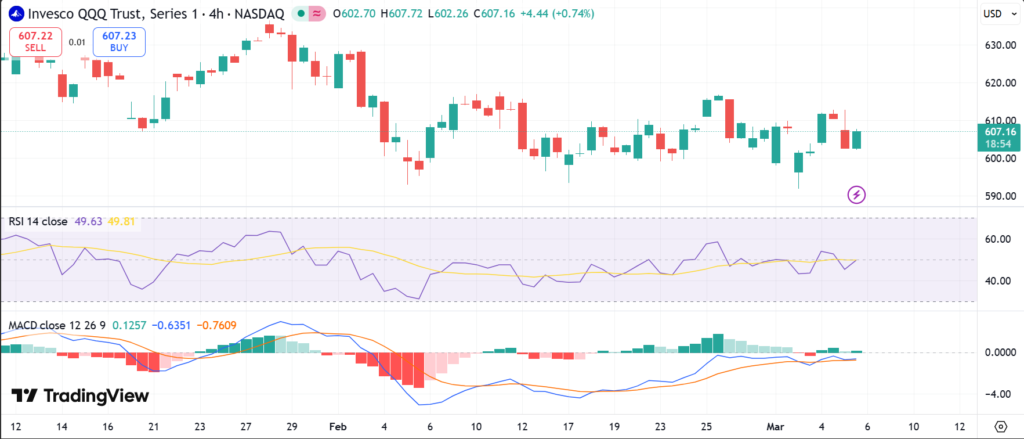
RSI reading hovers near 50 post-March dip, neutral—not overbought above 70 or oversold below 30—showing balanced momentum. MACD trend leans bearish short-term with lines converging, signaling potential slowdown after 6-month gains.
The 50-day moving average sits above the 200-day, no death cross yet, supporting bullish bias. Trading volume trends steady but lower on dips, hinting reduced panic selling. These QQQ technical analysis signs point to consolidation before next move.
Key Indicators Table
Indicator Current Reading Implication
Support $591-$596
Buying interest likely
Resistance $612-$617
Selling pressure ahead
RSI ~50 (neutral)
No extreme momentum
MACD Bearish crossover risk
Watch for trend shift
50/200-Day MA 50-day > 200-day
Long-term uptrend intact
Analyst Ratings & Price Targets
Analysts rate QQQ ETF mostly Buy, with few Holds amid tech optimism—exact counts vary by firm but lean positive. Average price target nears $650, highest at $700 from bullish AI calls, lowest $580 on valuation worries.
Recent upgrades from Goldman Sachs cite Nasdaq-100 earnings strength. This sentiment signals confidence in QQQ ETF growth, but investors should weigh macro risks before acting.
Insider Activity
QQQ ETF lacks direct insiders as a passive fund, but holdings like Nvidia show net buying in Q4 2025. No major selling waves reported recently, implying steady management confidence in tech leaders.
Trends suggest caution—minimal large transactions point to hold patterns, not aggressive moves.
Valuation Analysis
Trailing P/E for QQQ ETF holdings averages 35x, forward P/E at 28x, reflecting growth premium. Price-to-sales sits high at 8x due to tech margins.
Revenue growth YoY for Nasdaq-100 hits 15%, EPS up 20% from AI tailwinds. Free cash flow strong at $200B+ aggregate, low debt versus $300B cash pile. Compared to S&P 500 ETFs, QQQ ETF looks fairly valued, not overvalued despite hype.
Recent Earnings & Catalysts
Nasdaq-100 components beat Q4 2025 expectations, with aggregate revenue up 12% versus forecasts. EPS topped by 8%, driven by Big Tech.
Forward guidance points to 18% growth in 2026 from AI and cloud. Catalysts include Nvidia chip launches and Microsoft AI deals, boosting QQQ ETF post-earnings.
Bullish Case
AI adoption fuels 20%+ revenue for top holdings like Nvidia. Strong market demand for cloud services aids Amazon, Microsoft.
Operational efficiencies cut costs, lifting margins to 30%. QQQ ETF benefits from these tech advantages steadily.
Bearish Case
Rising competition from AMD erodes Nvidia share. Slowing China demand pressures sales.
Margin squeezes loom from higher rates; regulatory scrutiny on Big Tech grows. Economic slowdown hits ad revenue for Alphabet.
Market Sentiment & Investor Psychology
Short interest low at under 2%, showing limited bear bets. Options skew to calls over puts, bullish tilt.
Institutions hold 50%+ of QQQ ETF, steady inflows. Retail chases momentum, neutral-to-optimistic vibe overall.
Short-Term Outlook
Technicals show support at $596 holding, with volume stabilizing. Momentum softens near resistance—expect sideways grind unless Fed news sparks breakout. QQQ ETF price may test $600 floor.
Medium to Long-Term Outlook
Robust Nasdaq-100 model thrives on tech innovation, 15% industry growth. Competitive edge from AI leaders positions QQQ ETF well.
Financial health solid; hold for long-term gains, accumulate on dips.
FAQ Section
Is QQQ ETF a Buy Right Now?
Yes for growth investors—strong holdings outweigh short-term volatility.
What is the QQQ ETF Price Target?
Analysts eye $650 average by year-end 2026.
What Are Major Risks for QQQ ETF?
Valuation stretch, rate hikes, tech competition.
QQQ ETF Forecast 2026?
Bullish to $700 if AI delivers, per optimists.
Suggestions
Compare with SOXS ETF analysis
See our Nasdaq-100 forecast
Read our AI tech sector breakdown
Conclusion
Hold QQQ ETF for patient investors eyeing tech recovery; watch for $600 support break. Balanced growth justifies position amid risks.
Disclaimer: This article is for informational purposes only and not financial advice.