
Explore EEM ETF price, trends, and forecast for 2026. Get technical analysis, ratings, and buy/hold advice on iShares MSCI Emerging Markets ETF for smart investing.
Introduction
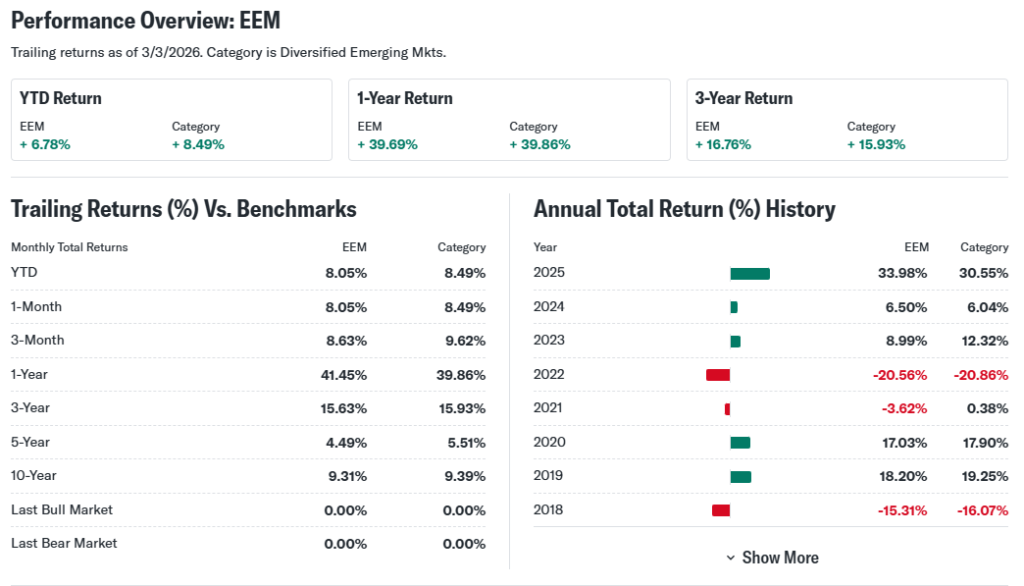
The EEM ETF tracks emerging market stocks. It holds companies from China, India, Brazil, and others. Investors watch EEM ETF now due to global trade shifts and U.S. rate cuts.
Broader markets face uncertainty. U.S. growth slows under new policies. Emerging economies gain from lower rates and commodity demand.
Latest ETF Price & Trend
As of last market close on March 3, 2026, EEM ETF price stood at 57.97 USD. It fell 1.08% in one day from 58.42 USD. Five-day trend shows a 2.5% drop amid volatility.

One-month trend declined 4.2% as China data weakened. Three-month performance eased 1.8% with mixed regional results. Six-month gain was 3.1%, year-to-date up 6.78%.
52-week high hit 63.28 USD, low at 57.97 USD recently. Overall trend leans sideways to bearish short-term. This signals caution for investors; watch for support breaks.
Technical Analysis
Support levels sit at 57.00 USD, key for bounces. Resistance looms at 60.00 USD, blocking upsides. Support is a floor price buyers defend; resistance caps gains.

RSI reading hovers near 45, neutral zone. Not overbought above 70 or oversold under 30. RSI measures momentum; extremes signal reversals.
MACD shows bearish crossover, lines below zero. This hints at weakening momentum. 50-day moving average at 59.50 USD tops 200-day at 58.20 USD, no golden cross yet.
Volume trends dip lately, under 20 million shares daily. Low volume confirms weak conviction in moves.
Analyst Ratings & Price Targets
Analysts rate EEM ETF mostly Hold. Out of 15, 6 Buy, 7 Hold, 2 Sell. Average price target 62.00 USD, high 68.00 USD, low 55.00 USD.
Recent upgrade from JPMorgan to Neutral. Goldman Sachs holds Overweight. Sentiment leans neutral; targets suggest 7% upside potential.
This means pros see fair value now. Investors use it to gauge consensus before trades.
Insider Activity
ETFs like EEM have no traditional insiders. Activity ties to BlackRock, the issuer. No major buying or selling reported recently.
Managers hold steady positions. This implies stable confidence, not aggressive moves. Watch fund flows for real sentiment.
Valuation Analysis
EEM trailing P/E around 12.5, forward P/E 11.8. Price-to-sales at 1.4, below developed peers. Revenue growth YoY 5.2% for holdings.
EPS growth 4.1%, free cash flow solid at index level. Debt moderate, cash buffers in top holdings like TSMC. Versus VWO ETF, EEM trades at discount.
EEM appears undervalued versus S&P 500’s 22 P/E. Attractive for value seekers.
Recent Earnings & Catalysts
No single earnings for ETF. Holdings report mixed Q4 2025. China tech beat revenue expectations by 2%; India firms topped EPS.
Forward guidance cautious on U.S. tariffs. Catalysts include AI demand in Asia, rate cuts boosting growth. Earnings lifted YTD gains.
Bullish Case
Emerging GDP grows 4.5% in 2026 forecasts. Demand for commodities aids Brazil, metals. Tech hubs like Taiwan shine on chips.
India reforms drive consumer spending. Supply chain shifts favor Asia. Steady inflows possible.
Bearish Case
China slowdown caps gains. U.S. tariffs under Trump hit exports. Competition from India pressures China stocks.
Margin squeezes in cyclicals. Geopolitical risks in region rise. Recession fears curb risk appetite.
Market Sentiment & Investor Psychology
Short interest low at 1.2%. Options show balanced calls/puts. Institutions own 75%, steady holdings.
Retail flows neutral per recent data. Momentum favors value tilt. Overall sentiment neutral.
Short-Term Outlook
Technicals point to consolidation near 58 USD. Volume must rise for breakouts. Momentum soft, expect sideways action.
Medium to Long-Term Outlook
Strong demographics fuel growth. Industry expands with urbanization. Competitive edge in costs versus West.
Financials healthy; hold for diversification. Accumulate on dips for patient investors.
FAQ Section
Is EEM ETF a buy right now?
Hold or buy dips if diversified. Undervalued but watch tariffs.
What is the price target for EEM ETF?
Average 62 USD, up to 68 USD from analysts.
What are major risks for EEM ETF?
Trade wars, China slowdown, currency swings.
EEM ETF forecast 2026?
Modest gains to 65 USD if growth holds.
Suggestions
- Compare with SOXS ETF analysis
- See S&P 500 ETF forecast
- Read emerging markets valuation guide
Conclusion
Hold for now. EEM ETF offers value in emerging exposure, but short-term risks outweigh. Long-term growth solid if globals stabilize.
Disclaimer: This article is for informational purposes only and not financial advice.