
Uncover TLT ETF price trends, technical analysis, and 2026 forecast. Is TLT ETF a buy amid rate shifts? Explore yields, risks, and Treasury bond insights.
Introduction
TLT ETF tracks U.S. Treasury bonds over 20 years long. It gives safe income from government debt. Investors watch TLT ETF now with Fed rate decisions looming in 2026.
Bond yields fluctuate on inflation data. Broader markets see stocks volatile, boosting safe-haven demand for TLT ETF price.
Latest ETF Price & Trend
Using last market close on March 4, 2026, TLT ETF stood at $89.21. It gained 0.2% that day, ranging from $89.00 to $89.36.
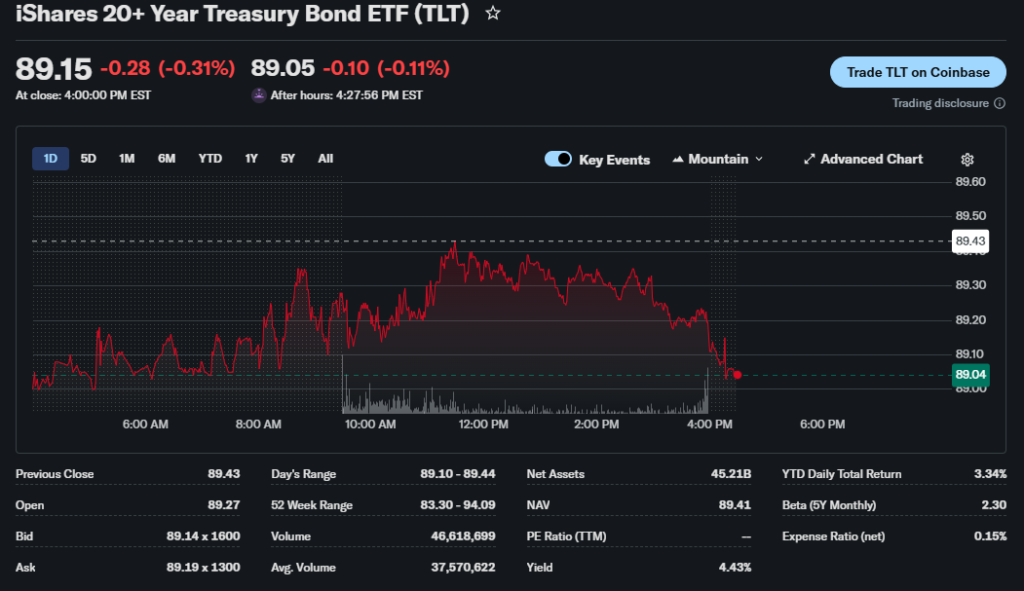
Five-day trend rose 1.1% from prior lows near $88.30. One-month up 3.14% since early February around $86.50.
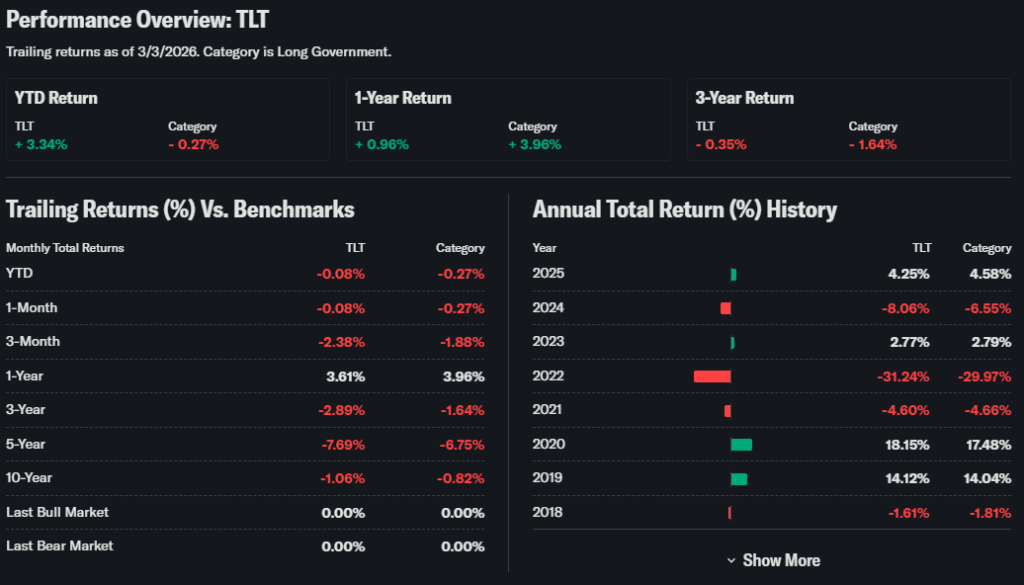
Three-month performance climbed 7.43%. Six-month gain hit 4.5%. Year-to-date 2026 shows +2.1%.
52-week range from $83.91 low to $92.87 high. Overall trend turns bullish. This suggests gains for fixed-income seekers as rates ease.
Technical Analysis
Support holds at $88.50, key recent low. Below signals pullback risk. Resistance at $90.50 tests upside breaks.
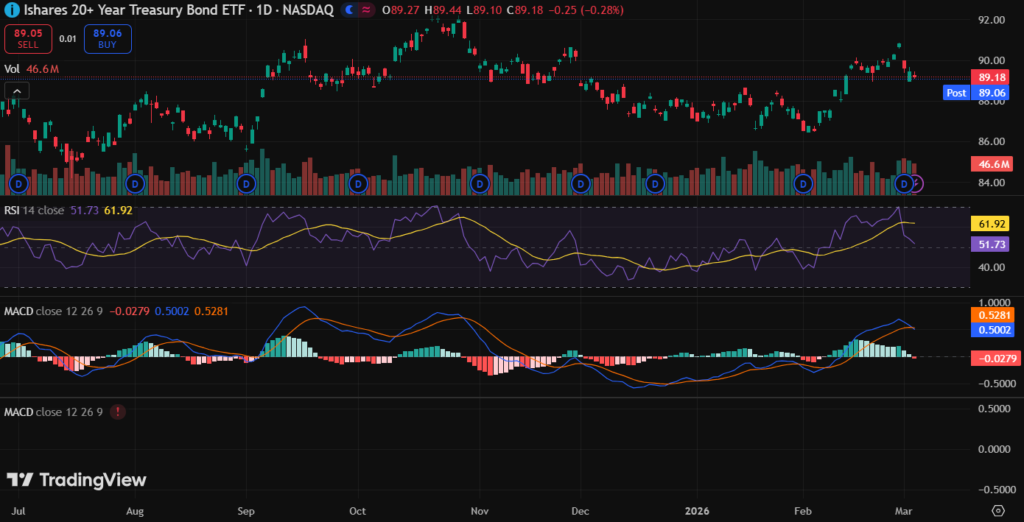
RSI at 55 stays neutral, not overbought. MACD turns bullish on recent crossovers. 50-day average $88.80 tops 200-day $87.20, forming golden cross.
Volume rose to average 45 million shares lately. Spikes validate rallies. These tools simplify TLT ETF technical analysis for starters.
Analyst Ratings & Price Targets
Bond ETF ratings sparse. Morningstar rates neutral to positive. Average target $92.00, high $95.00, low $88.00.
JPMorgan sees upgrades on rate cut bets. No downgrades recent. Wall Street links TLT ETF forecast to Fed path.
Pros signal caution with opportunity.
Insider Activity
TLT ETF runs passive, no insiders. Treasury flows show Fed buying steady. Manager activity minimal.
No big sells noted. Patterns reflect policy confidence, not corporate moves.
Valuation Analysis
TLT ETF focuses yield over P/E. Current yield near 4.56%. Duration over 17 years amps rate sensitivity.
No revenue or EPS direct. Cash flows from coupons reliable at $3.94 per share annual. Debt-free as Treasuries.
Versus IEF ETF, TLT ETF seems undervalued for long-duration plays.
Recent Earnings & Catalysts
ETFs lack earnings reports. Holdings paid steady coupons Q1 2026. Yields beat short-term bonds.
Guidance ties to 10-year yield drops. Catalysts feature Fed pauses, boosting prices 3% post-meetings.
Performance tracks rate expectations well.
Bullish Case
TLT ETF rises on falling yields. Demand grows in uncertainty. Long maturity amplifies gains.
Safe status draws capital. Soft landing aids returns.
Bearish Case
Rising rates crush prices fast. Inflation spikes hurt. Liquidity dips in stress.
Competition from stocks pulls funds. Policy shifts add volatility.
Market Sentiment & Investor Psychology
Short interest below 0.5%. Calls outpace puts lately. Institutions hold 70%, inflows up.
Retail favors safety amid volatility. Value tilt dominates. Sentiment turns optimistic.
Short-Term Outlook
Technicals favor mild upside. Momentum builds on volume. Fed speeches key.
TLT ETF price eyes $90 range soon.
Medium to Long-Term Outlook
TLT ETF excels in low-rate cycles. Treasury growth stable. Position tops for duration bets.
Health rock-solid. Long-term holders should accumulate on weakness.
FAQ Section
Is TLT ETF a buy right now?
Yes for duration exposure. Bullish trend supports.
What is the price target for TLT ETF?
Average $92 from models.
What are major risks for TLT ETF?
Rate hikes, inflation rebound.
TLT ETF forecast 2026?
Upside if cuts continue.
TLT ETF technical analysis update?
Golden cross signals strength.
Suggestions
- Compare with SOXS ETF yields
- See our long-term Treasury guide
- Read rate outlook analysis
Conclusion
Buy TLT ETF on dips. Rate sensitivity offers value. Track Fed moves carefully.
Disclaimer: This article is for informational purposes only and not financial advice.