
Analyze SOXS ETF price, technical analysis, forecast, and ratings. Is SOXS ETF a buy? Get insights on 3x inverse semiconductor trends for 2026 traders.
Introduction
SOXS ETF seeks 3x inverse daily returns of the PHLX Semiconductor Sector Index. It gains when chip stocks fall, serving as a hedge tool. Investors watch SOXS ETF now amid AI chip rallies cooling off. Broader markets grapple with trade tensions and Fed signals hitting tech ETFs.
Latest ETF Price & Trend
SOXS ETF traded at $2.04 on March 2, 2026 close per Yahoo data. It rose 14% that day from $1.79 amid sector weakness. Five-day gains topped 20% on pullbacks. One-month performance climbed 11.34% as semis dipped.

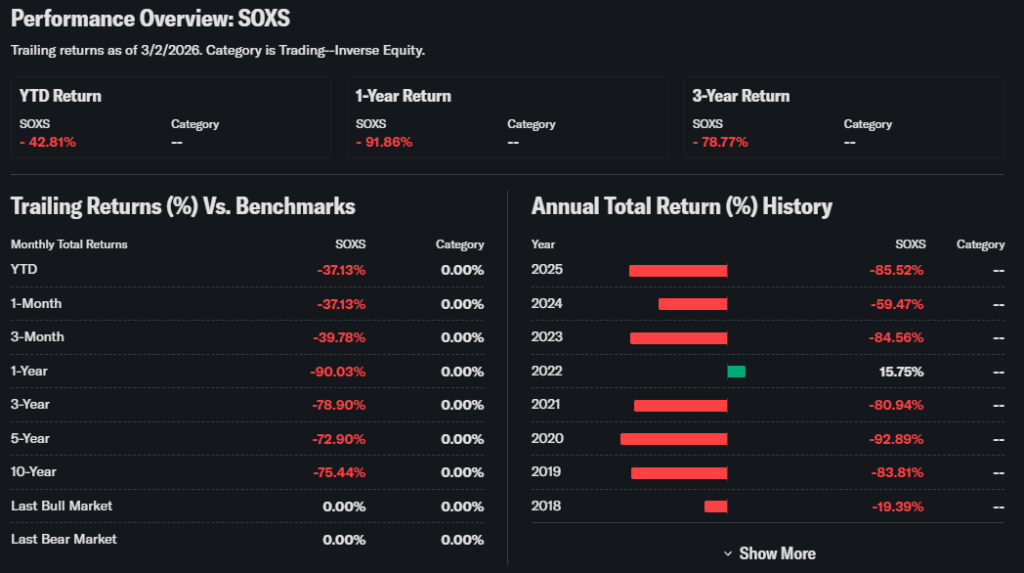
Three-month trend up sharply from lows; six-month shows volatility swings. Year-to-date sits at 42.81% through early March. 52-week high near $8, low around $1.80. Bearish index fuels bullish SOXS path, but long holds erode value. This flags short-term trade potential with decay risks.
Technical Analysis
Support levels firm at $1.95, recent trading floor. Resistance hits $2.20, prior peaks. RSI above 70 marks overbought zone after run. MACD turned positive January 30, signaling momentum.
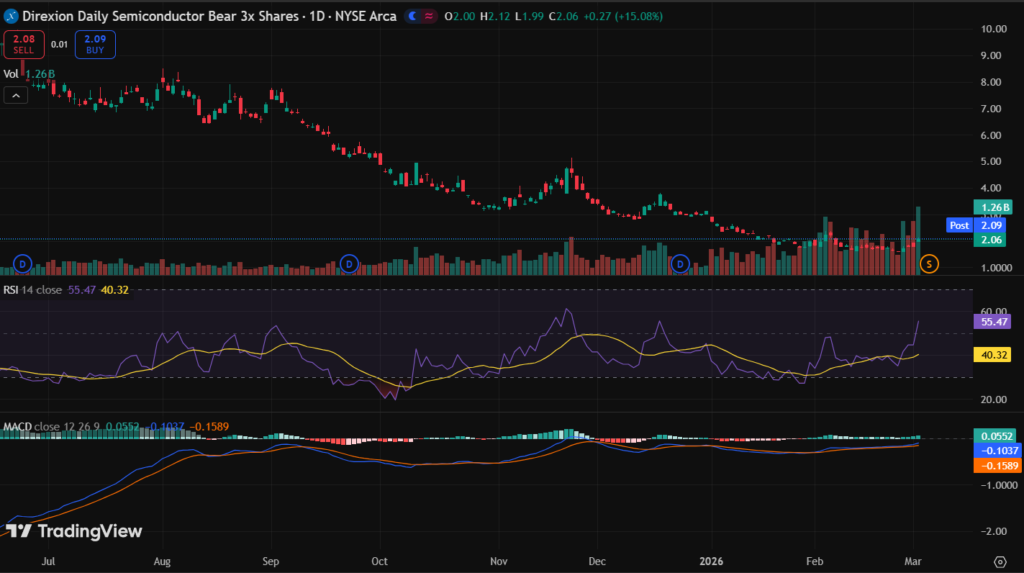
50-day average at $10.16 well above price; 200-day at $19.30 shows downtrend. No golden cross; death cross lingers. Volume spiked to millions on advances. Support catches dips for entries. Resistance tests seller strength. RSI spots exhaustion levels. MACD reveals trend speed changes. Moving averages filter noise; crosses predict shifts. High volume validates moves.
Analyst Ratings & Price Targets
Traditional ratings scarce for leveraged inverse like SOXS ETF. Seeking Alpha momentum grade F versus peers. No Buy/Hold/Sell counts; tactical Hold implied. Targets range $1.50 low to $3 high on volatility. No recent upgrades; focus on timing. Wall Street views suit hedges, not core bets. Sentiment stresses short-term use only.
Insider Activity
ETFs lack insiders; flows proxy activity. SOXS AUM hit $1.12 billion with $1.76 billion 1-year inflows. Creation units grew on demand. No outflows signal positioning for dips. This reflects trader confidence in semi weakness.
Valuation Analysis
No P/E for inverse ETF; expense ratio 0.97% trails returns. NAV trades at slight discount -0.4%. No revenue, EPS, or cash flow direct.
Debt via swaps for leverage. Versus SOXL bull fund, SOXS mirrors at higher decay risk. Fairly valued for tactical plays.
Recent Earnings & Catalysts
No ETF earnings; tracks index inverse. Semi sector faced tariff fears, slowing AI demand. Catalysts include trade war escalations, chip supply gluts. Guidance absent; performance surged on NVDA/AMD pauses. Sector rotation boosted SOXS ETF price.
Bullish Case
Semiconductor overvaluation invites corrections. SOXS ETF triples those drops daily. Trade barriers hit exports. Inventory builds pressure margins. Hedge demand rises in rotations.
Bearish Case
Contango erodes in flat markets. 3x leverage decays holdings fast. 0.97% fees compound pain. AI boom resumption crushes shorts. Regulation shields semis long-term.
Market Sentiment & Investor Psychology
Short interest low under 1%. Options tilt calls on spikes. Institutions hold 329 million shares. Retail momentum chasers dominate. Sentiment optimistic for bears, fearful of rebounds.
Short-Term Outlook
Overbought RSI eyes pullback. MACD supports if semis weaken. Volume trends confirm strength. Choppy action likely without catalysts.
Medium to Long-Term Outlook
Inverse model thrives on downturns, fails in bulls. Semi growth tied to AI persists. Position weakens versus leaders. Health demands volatility. Long-term investors watch entries, avoid holds.
FAQ Section
Is SOXS ETF a buy right now?
Watch for semi peaks; Hold tactical only.
What is the price target for SOXS ETF?
$1.50-$3 range; volatility driven.
What are major risks for SOXS ETF?
Decay, fees, sector rebound.
SOXS ETF forecast short term?
Up if semis dip; overbought cap.
SOXS technical analysis key?
RSI 70+, MACD positive, volume high.
Suggestions
- Compare with SOXS bull ETF.
- See semiconductor sector forecast.
- Read leveraged inverse ETF guide.
Conclusion
Watchlist SOXS ETF for hedges. Gains in dips offset by decay risks. Suits traders timing semis.
Disclaimer: This article is for informational purposes only and not financial advice.