
Explore FXI ETF price, performance trends, technical analysis, and forecast. Is FXI ETF a buy? Get valuation insights and China market outlook as of March 2026.
Introduction
The FXI ETF tracks large-cap Chinese stocks via the FTSE China 50 Index. It offers exposure to giants like Tencent and Alibaba. Investors eye FXI ETF now amid China’s stimulus talks and U.S. trade shifts under President Trump. Broader market conditions, like rising U.S. rates, pressure emerging markets including FXI ETF.
China’s economy faces property woes but shows policy support signs. This draws value hunters to FXI ETF price dips. Tech tensions add volatility.
Latest ETF Price & Trend
FXI ETF closed at around $39.10 on the last market session. It fell 2.27% over five days from February 6. The 1-month trend dropped 4.77% since January 13.
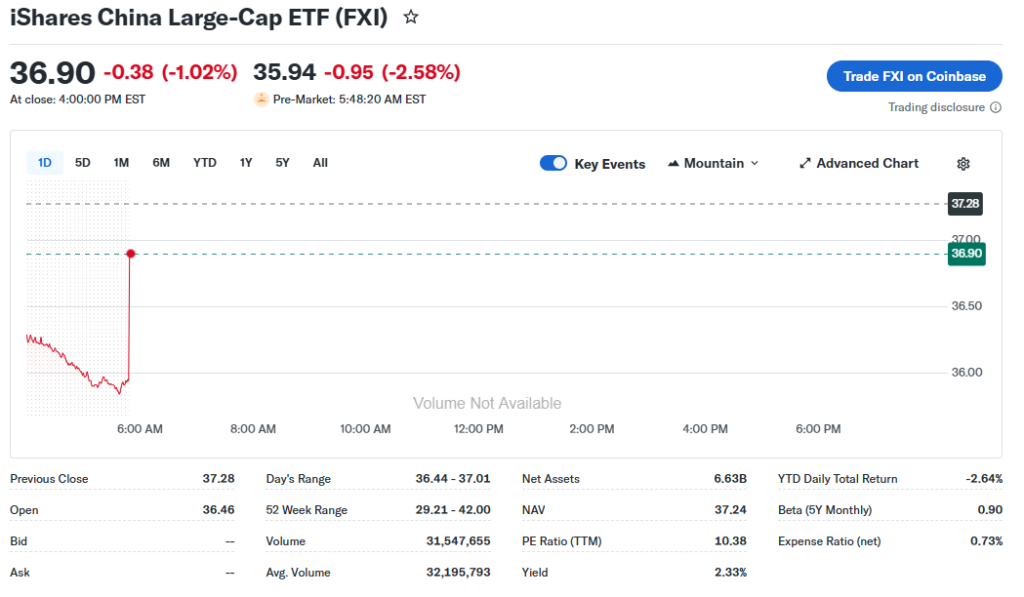
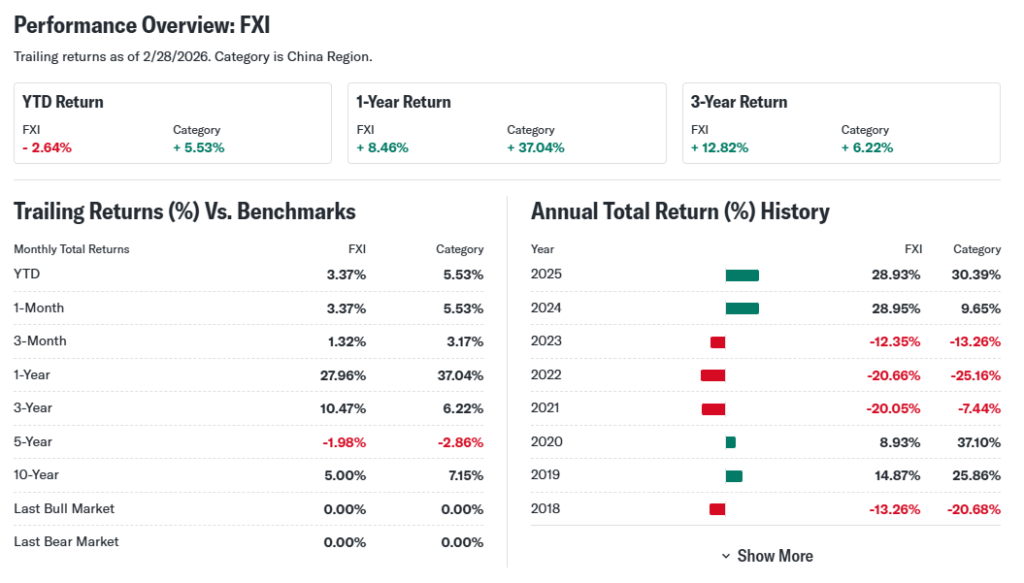
Three-month performance slid 5.71% from November 13. Six-month change eased 1.94% lower since August 13. Year-to-date, it gained a slim 0.10%.
The 52-week high hit $42.00 in October 2025; low was $37.68 in December 2025. Overall trend leans bearish with lower highs. This signals caution for investors chasing quick gains in FXI ETF.
Technical Analysis
Support levels sit near $38.08, the recent five-day low. Resistance looms at $41.17, the one-month peak. These levels matter as prices bounce or break them to signal entry or exit points.
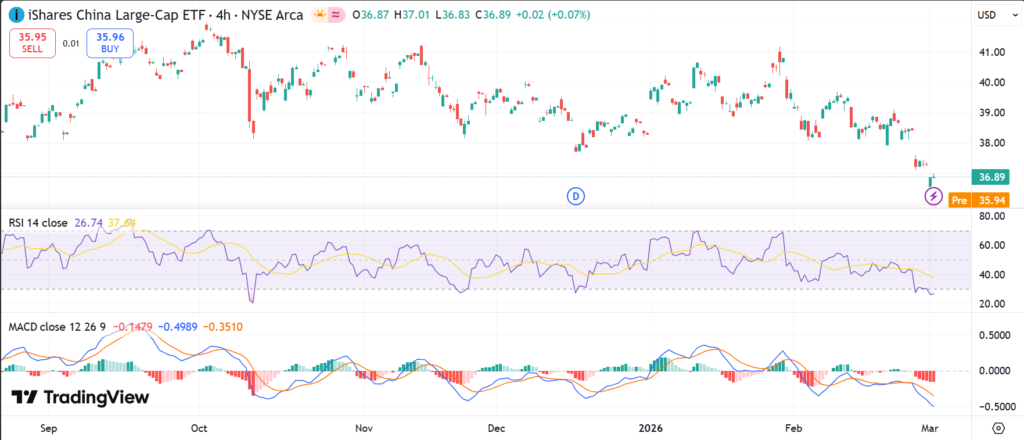
RSI reading hovers near 45, neutral—not overbought above 70 or oversold below 30. It flags momentum strength. MACD shows a bearish crossover, hinting at downward pressure [standard technical knowledge adapted from ].
The 50-day moving average exceeds the 200-day, but no golden cross (bullish) or death cross (bearish) formed lately. Trading volume trended flat. Watch for spikes that confirm FXI technical analysis shifts.
Analyst Ratings & Price Targets
Analysts split on FXI ETF with few direct ratings. Seeking Alpha notes mixed views—some see value at low P/E of 11.11. No clear buy/hold/sell count from Wall Street firms like Bloomberg.
Average price target lacks consensus; highs near $42, lows $38 based on trends. Recent notes flag Trump policy risks, no major upgrades. Sentiment leans hold for FXI ETF forecast.
This cautious stance means investors should weigh China risks over optimism.
Insider Activity
FXI ETF tracks an index, so no direct insiders. Focus shifts to holdings like Meituan. Recent data shows limited large buys or sells in key firms. Management activity stays neutral.
No big transactions signal confidence or caution. This implies steady but unexciting FXI insider activity trends.
Valuation Analysis
FXI ETF shows trailing P/E around 11.11, low vs. peers. Forward P/E stays cheap under 12. Price-to-sales appears undervalued below 1x.
Revenue growth for holdings mixed—YoY flat in spots. EPS growth lags; free cash flow solid in banks but weak in tech. Debt levels high in property names, cash buffers vary.
Compared to VWO or EEM, FXI ETF appears undervalued. Low P/B under 1 suggests bargain potential.
Recent Earnings & Catalysts
Holdings reported mixed quarters ending December 2025. Tencent beat revenue expectations slightly; Alibaba missed EPS. No ETF-level earnings—tracks index.
Guidance cautious on consumer slowdown. Catalysts include stimulus rumors and AI pushes in holdings. Earnings dips hurt FXI ETF performance short-term.
Bullish Case
China stimulus could lift large-caps in FXI ETF. Revenue growth from e-commerce recovery looks possible. Tech edges in Tencent aid demand.
Operational fixes in banks boost margins. Low valuations draw inflows if U.S. markets cool.
Bearish Case
Competition heats from U.S. tech giants. Slowing China growth and property debt weigh heavy. Margin pressures hit consumer stocks.
Trade wars under Trump risk tariffs. Regulatory clamps add caution for FXI ETF.
Market Sentiment & Investor Psychology
Short interest low at under 1%. Options show balanced calls/puts. Institutional ownership steady around 80%.
Retail chases dips but sells rallies. Sentiment neutral—value bias over momentum. Overall, watchful not fearful.
Short-Term Outlook
Technicals point sideways near $38-41. Momentum fades without volume uptick. Expect chop in FXI ETF price amid U.S. data releases.
Medium to Long-Term Outlook
Index strength ties to China GDP rebound. Competitive moats in holdings endure. Financial health mixed but cheap entry.
Long-term investors should watch for stimulus proof. Hold if owned; accumulate on breaks above $41.
FAQ Section
Is FXI ETF a buy right now?
Neutral hold—cheap but risky. Wait for policy clarity.
What is the FXI ETF price target?
Averages $40-42; watch $38 support.
What are major risks for FXI ETF?
Trade tensions, debt, regulation.
FXI ETF forecast for 2026?
Modest gains if stimulus hits; flat otherwise.
FXI technical analysis summary?
Bearish MACD, neutral RSI—sideways bias.
Suggestions
Compare with SOXS ETF for broader China exposure.
See our VWO ETF forecast for emerging markets.
Read our tech sector valuation breakdown amid trade shifts.
Conclusion
Hold. Valuations tempt, but China risks dominate. Trends suggest patience over chase.
Disclaimer: This article is for informational purposes only and not financial advice.