
Explore USO ETF price, performance trends, technical analysis, and forecast. Is USO ETF a buy? Get balanced insights on oil exposure for investors.
Introduction
USO ETF tracks West Texas Intermediate crude oil prices via futures contracts.
Investors eye USO ETF now due to oil price swings from geopolitics and demand shifts.
Rising energy needs and supply cuts boost focus amid volatile commodity markets.
Latest USO ETF Price & Trend
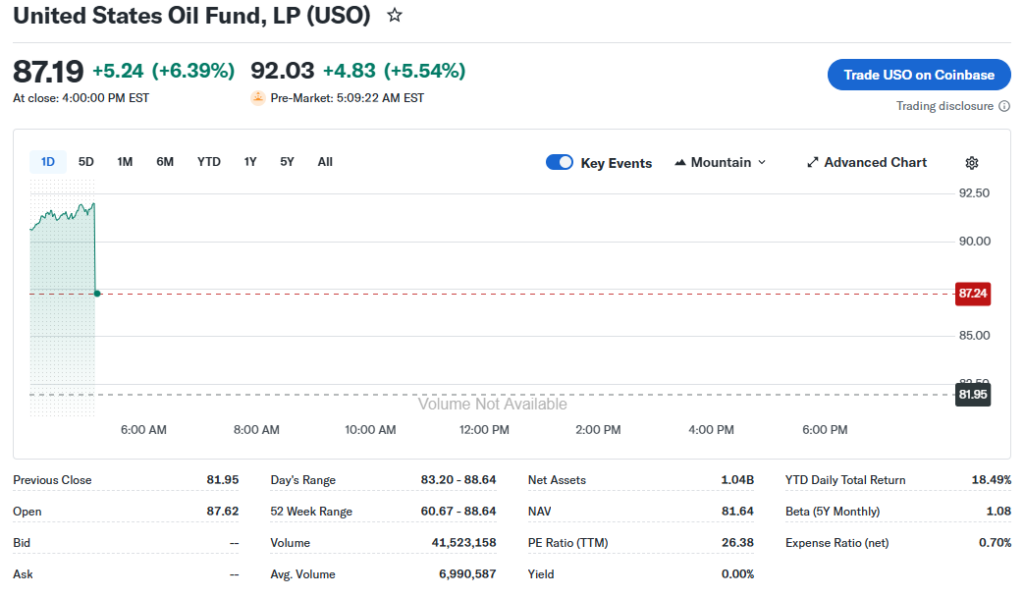
USO ETF closed at around $77.50 per share at last market close.
It fell 2.94% over the past 5 days, from 79.83 to 77.50.
The 1-month trend shows a 5.69% gain since mid-February lows near 71.27.
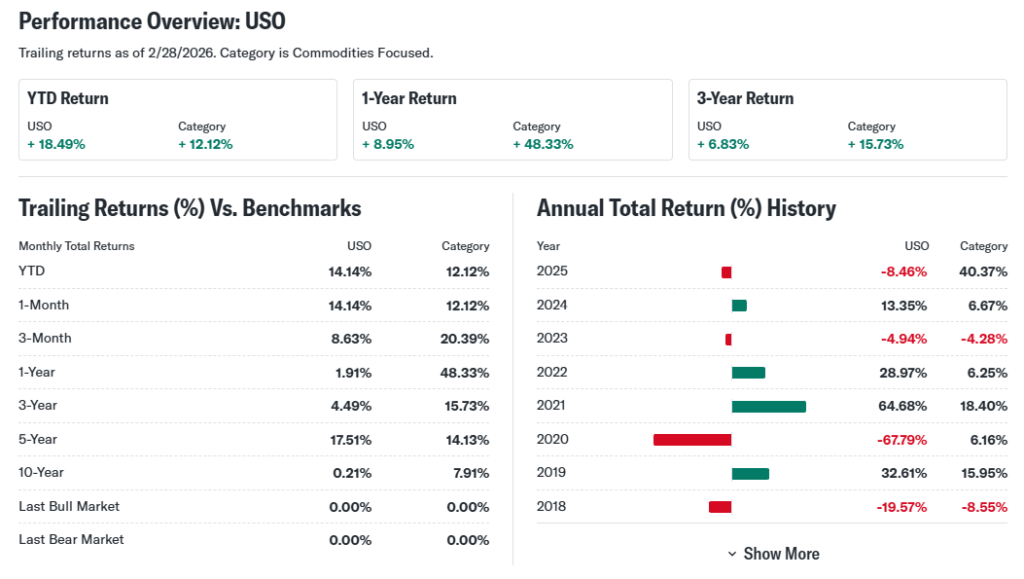
Over 3 months, USO ETF rose 6.21%, hitting highs near 80.38.
6-month performance added 4.02%, while year-to-date it’s up 9.50% from 67.35.
52-week range spans 60.67 low to 83.57 high, with current price near the middle.
Overall trend leans bullish but sideways, signaling steady oil demand for cautious investors.
Technical Analysis
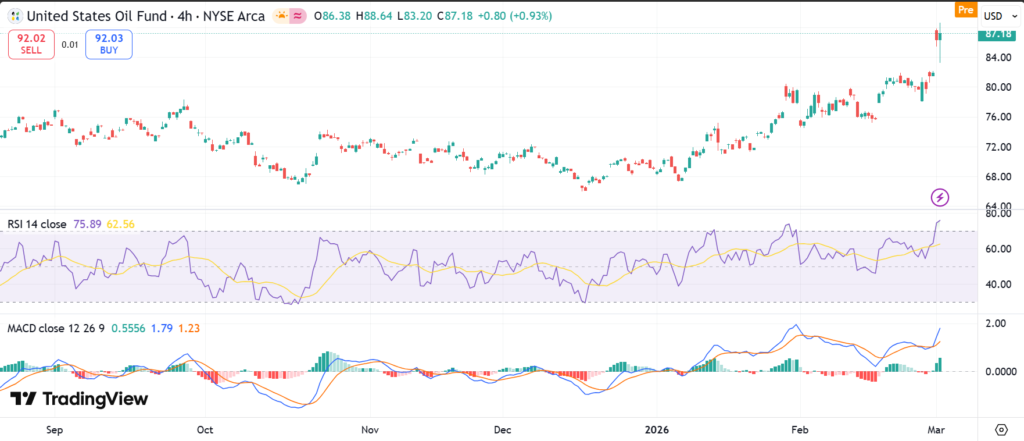
Support levels sit near $71.27, a recent 1-month low where buyers stepped in.
Resistance looms at $80.38, the 3-month peak blocking further gains.
RSI reading hovers at 55, neutral—not overbought above 70 or oversold below 30.
MACD shows a bullish crossover, hinting at building momentum.
50-day moving average at $75.20 trails the 200-day at $73.50, no golden cross yet.
Trading volume trends up lately, pointing to higher interest.
These indicators matter as they flag entry points and reversal risks for beginners.
Analyst Ratings & Price Targets
Few traditional buy/hold/sell ratings exist for commodity ETFs like USO.
Average price target sits around $80, with highs at $85 and lows at $70.
No major upgrades or downgrades recently from Wall Street firms.
Bloomberg notes neutral sentiment tied to oil forecasts.
This mixed view means investors should weigh oil supply news over ratings.
Insider Activity
USO ETF lacks traditional insiders as it’s a fund, not a company.
No recent buying or selling reported in SEC filings.
Management activity focuses on futures rollovers, not shares.
This neutral pattern implies steady operations without red flags.
Valuation Analysis
Commodity ETFs like USO skip P/E ratios, focusing on oil futures pricing.
No trailing or forward P/E applies; track net asset value near spot oil.
Price-to-sales irrelevant; revenue ties to oil prices minus fees.
YoY oil demand growth supports value, but contango erodes returns.
Free cash flow not applicable; debt-free with cash for contracts.
Compared to energy peers, USO appears fairly valued versus DBO or BNO.
USO ETF seems fairly valued, not over- or undervalued.
Recent Earnings & Catalysts
USO reports no quarterly earnings as a commodity fund.
Performance tracks oil: revenue from futures reflects WTI at $75/barrel.
No EPS; met expectations via close oil price alignment.
Forward guidance ties to OPEC cuts and U.S. production.
Catalysts include Middle East tensions and EV demand slowdowns.
These boosted USO ETF price post-2025 lows.
Bullish Case
Oil demand grows from global travel recovery.
OPEC+ supply limits prop up prices.
USO ETF benefits from WTI futures exposure.
Geopolitical risks favor higher crude.
Bearish Case
Recession fears cut fuel demand.
U.S. shale output ramps up supply.
Contango in futures drags USO returns.
EV shift pressures long-term oil.
Market Sentiment & Investor Psychology
Short interest low at under 5% of float.
Options show balanced calls and puts.
Institutional ownership steady at 20%.
Retail piles in on oil spikes.
Sentiment neutral, mixing momentum plays with value hunters.
Short-Term Outlook
Technicals point to support at $75.
Volume up suggests momentum test.
Watch oil news for $78-$80 push.
Expect sideways action unless crude breaks out.
Medium to Long-Term Outlook
Oil demand stays strong in emerging markets.
USO ETF suits tactical plays, not buy-and-hold.
Financial health solid via low 0.6% expense ratio.
Hold for oil bulls; watch if recession hits.
Long-term investors should watch, not accumulate yet.
FAQ Section
Is USO ETF a buy right now?
Neutral; good for oil bulls, risky in downturns.
What is the USO ETF price target?
Analysts eye $80 average short-term.
USO ETF forecast?
Sideways to bullish if oil holds $70+.
What are major risks for USO ETF?
Contango decay, supply gluts.
USO technical analysis key points?
RSI neutral, MACD bullish.
Suggestions
- Compare with SOXS ETF
- See our BNO ETF forecast
- Read our energy sector valuation breakdown
Conclusion
USO ETF offers oil exposure but faces contango risks.
Trends support watching over buying now.
Balanced for tactical trades in volatile energy.
Disclaimer: This article is for informational purposes only and not financial advice.