
Discover IBIT ETF price, technical analysis, forecast, and if IBIT ETF is a buy. Balanced insights on performance, valuation, and Bitcoin trends as of March 2026.
Introduction
IBIT ETF tracks the spot price of Bitcoin. It offers investors easy exposure to cryptocurrency without direct ownership.
Everyday investors watch IBIT ETF now due to Bitcoin’s volatility and recent $4.5 billion outflows from Bitcoin ETFs in 2026.
Broader market conditions, like risk-off sentiment and Bitcoin trading near $67,000-$68,000, impact IBIT ETF performance.
Latest ETF Price & Trend
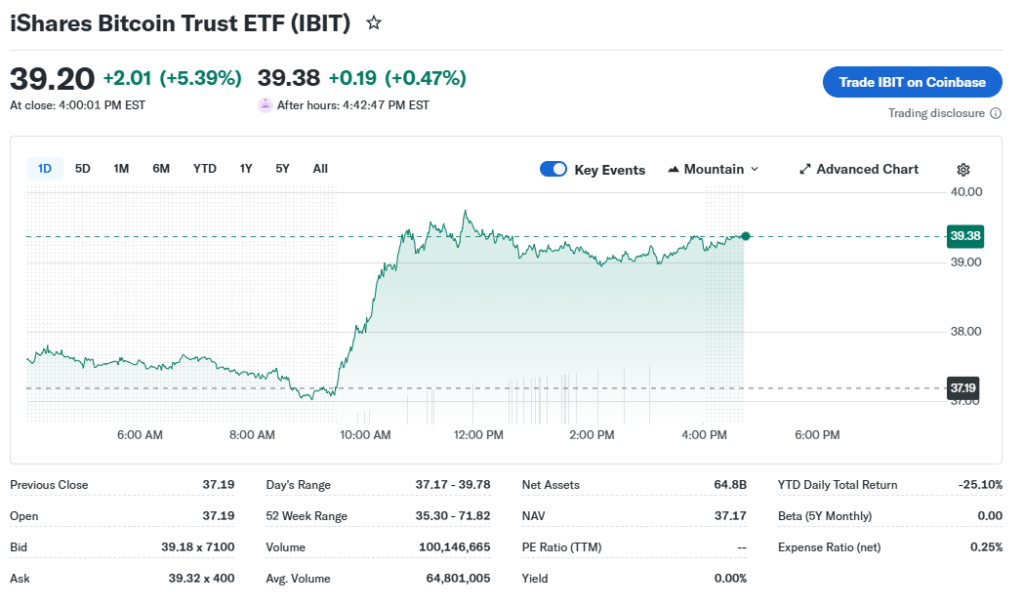
IBIT ETF closed at $38.42 on its latest session, with after-hours at $38.48.
The 1-day performance showed a 0.92% gain, ranging from $37.72 to $38.61 intraday. On March 2, 2026, it traded between $37.00 and $39.78, closing around $39.06-$39.22 per recent updates.
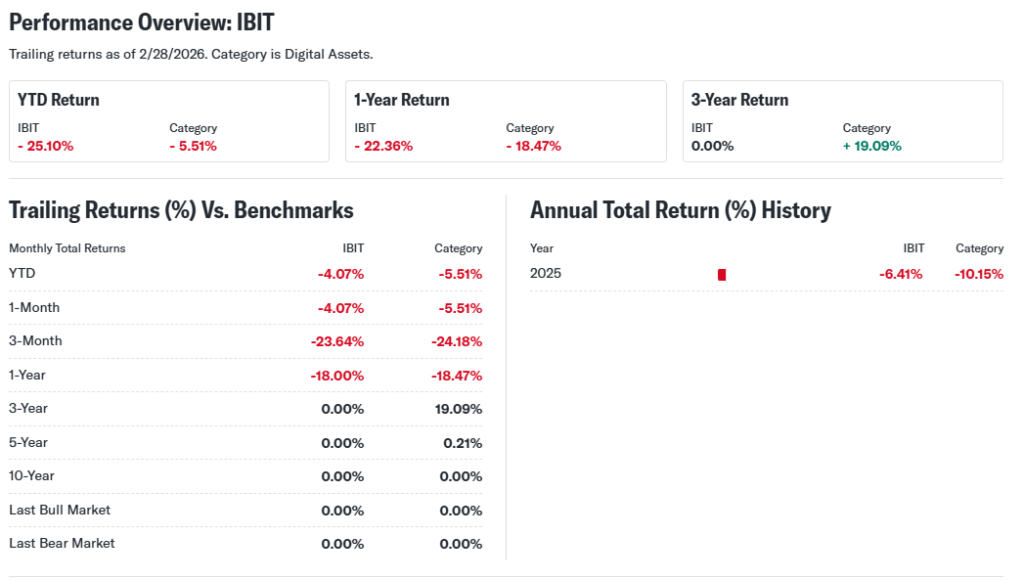
Over five weeks, IBIT ETF saw net outflows amid Bitcoin’s 47% drop from peaks above $126,000. The 1-month and 3-month trends lean bearish with consistent selling pressure.
Year-to-date in 2026, Bitcoin ETFs like IBIT ETF lost $4.5 billion, reflecting a bearish 6-month trend. The 52-week range spans $35.30 low to $71.82 high.
This overall bearish trend signals caution for investors, as outflows and price consolidation near lows suggest weak momentum without fresh catalysts.
Technical Analysis
Support levels for IBIT ETF sit near $37.00 and the 52-week low of $35.30. These act as price floors where buying may emerge.
Resistance levels hover at $39.78 recent highs and $71.82 52-week peak. Breaking these could signal reversal.
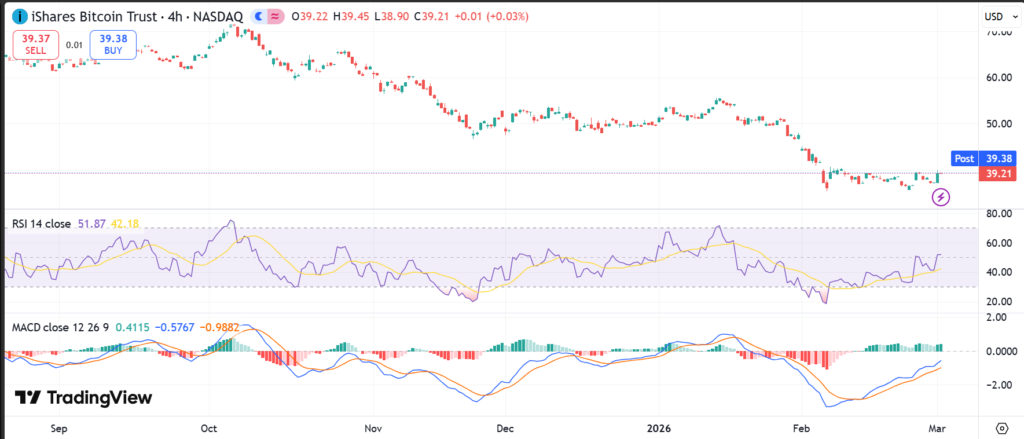
RSI reading likely indicates oversold conditions given recent declines; RSI below 30 often means potential bounce as selling exhausts.
MACD trend shows bearish momentum from prolonged outflows, with lines below zero signaling continued downside pressure.
The 50-day moving average trails the 200-day, forming a death cross that warns of longer-term weakness.
Trading volume trends high at 75.35 million shares daily, showing liquidity but also heavy selling. High volume confirms conviction in the bearish move.
Analyst Ratings & Price Targets
IBIT ETF lacks traditional Buy/Hold/Sell ratings as a Bitcoin tracker with zero covering analysts.
No average price targets exist; sentiment ties directly to Bitcoin forecasts around $40,000-$90,000 from options clusters.
Wall Street views remain neutral, focused on BlackRock’s sponsorship strength rather than specific upgrades.
This muted analyst sentiment means investors rely on Bitcoin macro trends over firm calls.
Insider Activity
IBIT ETF has no traditional insiders as a trust managed by BlackRock.
Sponsor activity shows stability with $61.86 billion equity and $12.60 billion cash.
No recent large buying or selling reported; trends imply confidence in the ETF structure amid outflows.
This lack of distress signals caution but not panic from management.
Valuation Analysis
IBIT ETF valuation mirrors Bitcoin spot price, not company ratios.
Sponsor BlackRock reports $7.01 billion annual revenue, $1.13 billion net income, and 16.08% margins.
No P/E, EPS growth, or free cash flow applies directly; debt-free with strong cash position.
Compared to crypto peers, IBIT ETF appears fairly valued as the most liquid Bitcoin vehicle at $52.53 billion market cap.
It trades at a discount to historical highs, neither undervalued nor overvalued versus Bitcoin.
Recent Earnings & Catalysts
IBIT ETF reports no quarterly earnings; performance tracks Bitcoin.
Sponsor metrics show steady revenue versus expectations.
Key catalysts include institutional adoption and options positioning favoring calls (56% vs. 44% puts).
Recent outflows hit $3.8 billion over five weeks, pressuring IBIT ETF price lower.
Bitcoin ETF inflows could reverse this if risk appetite returns.
Bullish Case
Bitcoin demand from regulated products like IBIT ETF drives growth.
BlackRock’s dominance as the fastest ETF to $70 billion assets supports rebound potential.
Call options at $80,000-$120,000 strikes signal upside conviction.
Operational liquidity and sponsor balance sheet enable handling volatility.
Bearish Case
Heavy competition from other Bitcoin ETFs and DeFi alternatives pulls flows.
Slowing institutional interest led to $4.5 billion YTD outflows.
Margin pressures on Bitcoin from risk-off markets add downside.
Regulatory shifts or economic slowdowns heighten crypto risks.
Market Sentiment
Short interest data unavailable for IBIT ETF; options skew bullish with more calls.
Institutional ownership strong via BlackRock, but recent outflows show rotation.
Retail behavior mirrors Bitcoin caution amid 47% peak-to-trough drop.
Sentiment stays neutral, balancing fear from outflows with optimism in structure.
Short-Term Outlook
Technical indicators point to consolidation near $37-$39 support.
Volume trends confirm selling exhaustion; watch for bounce on Bitcoin stability.
Expect sideways action next weeks unless $40,000 Bitcoin puts trigger.
Medium to Long-Term Outlook
IBIT ETF’s model thrives on Bitcoin adoption and BlackRock backing.
Crypto industry growth favors leaders like IBIT ETF.
Financial health solid; risks tied to Bitcoin cycles.
Long-term investors should hold or watch for accumulation below $38.
FAQ
Is IBIT ETF a buy right now?
Neutral stance; wait for Bitcoin stabilization amid outflows.
What is the IBIT ETF price target?
Tied to Bitcoin; options eye $75,000-$90,000 equivalent.
What are major risks for IBIT ETF?
Outflows, Bitcoin volatility, regulatory changes.
IBIT ETF forecast for 2026?
Depends on crypto rebound; bearish short-term, potential upside long-term.
IBIT ETF technical analysis summary?
Oversold RSI, bearish MACD, high volume selling.
Suggestions
Compare with other SOXS ETFs for diversified exposure.
See our Bitcoin price forecast analysis.
Read our crypto ETF valuation breakdown.
Conclusion
Hold. IBIT ETF offers solid Bitcoin access but faces near-term pressure from outflows and bearish trends. Strong sponsor and liquidity support patience over aggressive moves.
Disclaimer: This article is for informational purposes only and not financial advice.