
Explore RWM ETF price, technical analysis, forecast, and if RWM ETF is a buy. Detailed review of ProShares Short Russell2000 performance and small-cap inverse strategy as of March 2026
Introduction
RWM ETF offers inverse exposure to the Russell 2000 Index. It aims to gain when small-cap stocks fall by tracking the opposite daily performance of 2,000 U.S. small companies.
Investors watch RWM ETF now amid small-cap struggles in a high-interest-rate world. Broader markets favor big tech over volatile small firms this year.
Latest RWM ETF Price & Trend
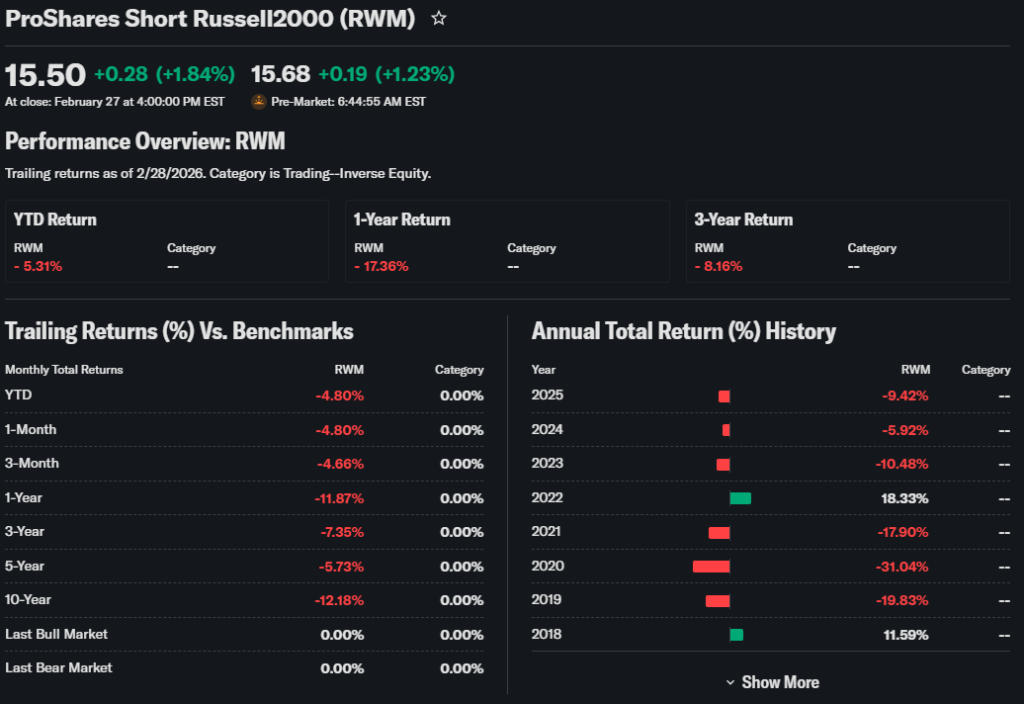
RWM ETF closed at $15.50 market price on February 27, 2026, with NAV at $15.49. It rose 1.8% that day on high volume of 26.8 million shares.
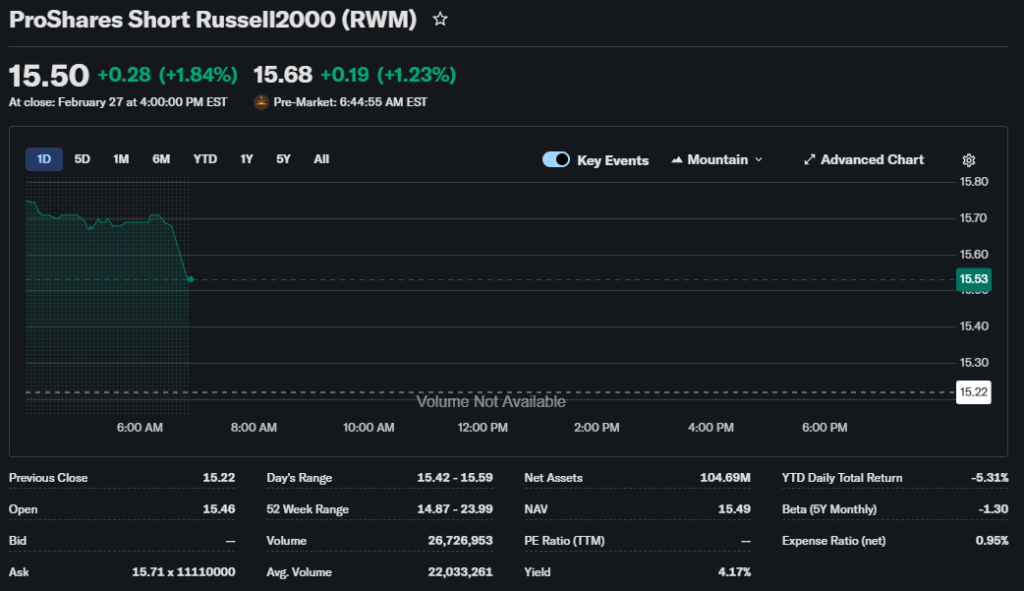
Over five days, RWM ETF gained amid short-term small-cap dips. The one-month trend shows a 4.83% drop, reflecting Russell 2000 gains of about 5%. Three-month performance fell 4.69%, six-month down 14.59%, and year-to-date declined 4.83%.
The 52-week range spans $14.87 low to $23.99 high. Overall trend looks sideways to bearish for RWM ETF, as small caps rally in 2026. This signals caution for bearish bets; investors may see limited upside unless small caps weaken.
Technical Analysis
Support levels sit near $15.11, a key floor where buyers may step in to halt declines. Resistance looms at $15.65; breaking it could spark short-term gains. These levels matter as they show where price stalls based on past trades.
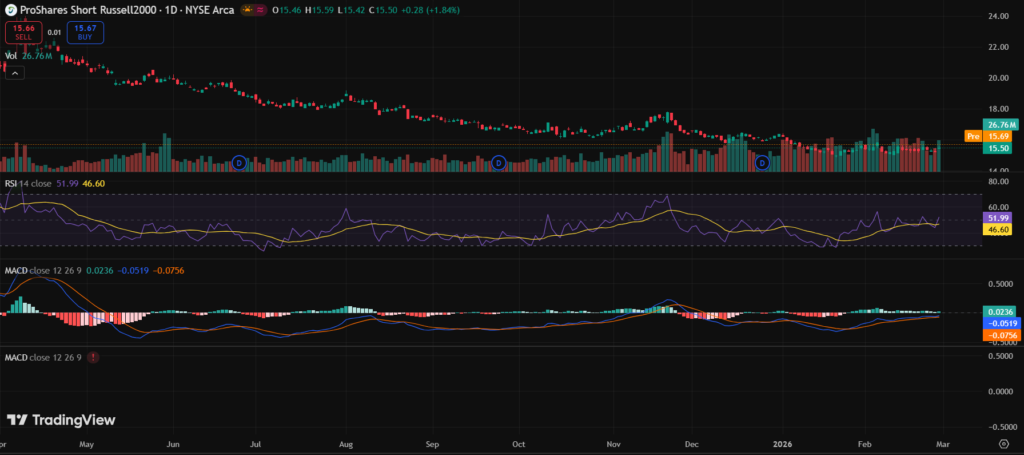
RSI reads 43.89, neutral—not overbought above 70 or oversold below 30. This gauge measures speed of price changes to spot exhaustion. MACD at -0.07 signals sell, hinting bearish momentum short-term.
The 50-day moving average hovers around $15.71, with 200-day at $17.25; RWM trades below both, no golden cross (bullish 50-day over 200-day). Volume spiked recently, supporting moves but trending average at 10 million shares.
Analyst Ratings & Price Targets
RWM ETF lacks traditional buy/hold/sell ratings as an inverse product. Aggregate views on holdings imply neutral to bearish sentiment for small caps. No major Wall Street upgrades noted recently.
Price targets average $15.58, with upside from current levels but high variance. Firms see it tied to Russell 2000 downside; sentiment warns of volatility. This means investors use RWM ETF for hedges, not long holds.
Insider Activity
No recent large insider buys or sells reported for ProShares Trust managing RWM ETF. SEC filings show minimal open-market trades by officers.
Trends indicate low management activity, common for ETFs without company insiders. This implies neutral confidence—no strong buying signals caution or optimism.
Valuation Analysis
Inverse ETFs like RWM lack P/E or EPS as they use swaps, not direct holdings. Expense ratio stands at 0.95% net, competitive for leveraged inverse. AUM around $127 million supports liquidity.
Dividend yield hits 3.99% TTM, paid quarterly at $0.136 last. Compare to peers: higher than many equity ETFs but reflects inverse payouts. RWM ETF appears fairly valued for its niche role, not undervalued like growth stocks.
Recent Earnings & Catalysts
RWM ETF reports no quarterly earnings; performance tracks daily inverse Russell 2000. Last distribution April 1, 2025, impacted yield positively.
Catalysts include small-cap earnings misses or rate hikes boosting RWM ETF. No specific partnerships; swaps with banks like Goldman drive exposure. Strong volume post-Fed news lifted recent price.
Bullish Case
RWM ETF rises if small caps falter from high rates or recession fears. Market demand grows for hedges during bull runs in large caps.
Operational edge from daily resets suits short-term trades. Tech in swaps ensures tight tracking of inverse moves.
Bearish Case
Prolonged small-cap rallies erode RWM ETF due to daily compounding decay. Competition from other inverse tools like SQQQ adds pressure.
Margin calls on swaps or volatility spikes hurt holds. Regulatory shifts on leveraged ETFs pose risks. Economic recovery favors Russell 2000 over RWM.
Market Sentiment & Investor Psychology
Short interest at 5.9% shows moderate bets against RWM ETF itself. Options lean calls if small caps seen topping. Institutional ownership dominates via swaps.
Retail chases momentum; value bias low for inverse plays. Sentiment neutral—optimistic on small caps, fearful for bears.
Short-Term Outlook
Technicals point neutral with RSI steady and volume high. Momentum favors small-cap strength, pressuring RWM ETF lower. Watch $15.11 support.
Medium to Long-Term Outlook
RWM ETF suits hedges, not buy-and-hold due to decay. Small-cap growth outlook strong; competitive position solid for short bets. Watch rates; hold for tactical use, avoid long-term.
FAQ Section
Is RWM ETF a buy right now?
No strong buy case; best for short-term small-cap hedges. Current price near support.
What is the RWM ETF price target?
Analysts eye $15.58 average, tied to Russell downside.
What are major risks for RWM ETF?
Compounding decay, small-cap rallies, high fees.
RWM ETF forecast next year?
Bearish if small caps rise; neutral otherwise.
Suggestions
Compare with SOXS ETF analysis
See our Russell 2000 forecast
Read our inverse ETF valuation breakdown
Conclusion
Watchlist. RWM ETF fits hedges amid small-cap strength; avoid long holds due to decay. Balanced view favors caution unless downturn hits.
Disclaimer: This article is for informational purposes only and not financial advice.