
Explore FXI ETF price, technical analysis, forecast, and ratings. Is FXI ETF a buy? Get insights on China large-cap exposure, valuation, and risks for investors.
Introduction
The FXI ETF tracks large Chinese companies listed in Hong Kong. It offers exposure to firms like Alibaba and Tencent.
Investors eye FXI ETF now due to China’s economic stimulus talks. Geopolitical tensions and U.S. trade policies sway its path. Broader market shifts in emerging markets add focus.
Latest FXI ETF Price & Trend
FXI ETF closed at $39.32 on the last market day. It saw a 0.24% gain that day amid steady trading.
Over five days, it held flat with minor ups and downs. The one-month trend rose 2.05%, showing short-term strength. Three months brought a 6.51% NAV gain, while six months climbed 18.91%.
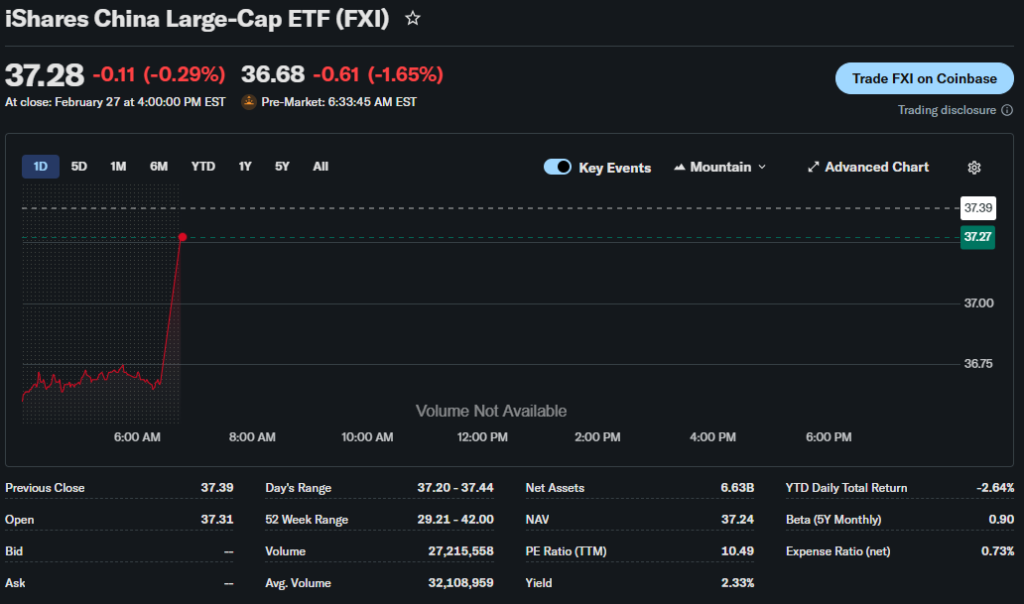
Year-to-date, FXI ETF gained 20.20%. The 52-week range spans $28.41 low to $42.00 high. This points to a bullish trend overall, but recent pullbacks signal caution for investors watching volatility.
Technical Analysis
Support levels sit at $37.25, a floor where buyers may step in. Resistance looms at $39.24, capping upside moves. These levels help spot entry or exit points.

RSI at 33.4 shows neutral to oversold conditions, hinting at potential rebound. MACD at -0.4 signals short-term sell pressure. RSI measures speed of price changes; low readings suggest oversold assets.
The 50-day moving average hovers near recent prices, above the 200-day at $38.69. No golden cross exists; price trades above both averages. Volume stays high at 27 million shares lately, confirming interest.
Analyst Ratings & Price Targets
Analysts lean mixed on FXI ETF. From 51 targets, average hits $47.67, with high at $60.34 and low $39.70. This implies 24% upside potential.
Recent views from Wall Street firms note China recovery bets. No major upgrades noted lately. Positive sentiment means analysts see value in large-cap China amid stimulus hopes.
Insider Activity
FXI ETF tracks public companies, so direct insider trades vary by holding. Recent data shows no standout ETF-level buys or sells.
Management at top holdings like Tencent show steady ownership. No large transactions flagged. Stable activity implies neutral confidence, not strong signals either way.
Valuation Analysis
FXI ETF’s trailing P/E stands at 11.47, low for growth markets. Forward P/E looks similar, with price-to-sales attractive versus U.S. tech peers like Microsoft.

Revenue growth in holdings averages solid YoY, driven by tech and banks. EPS growth supports this; free cash flow remains positive. Debt levels manageable with strong cash in banks.
Compared to broader EM ETFs, FXI appears undervalued. Low ratios suggest bargain for China exposure.
Recent Earnings & Catalysts
Holdings reported mixed quarters. Alibaba beat revenue expectations; Tencent guided steady. EPS mostly met marks.
Catalysts include China’s policy easing and AI pushes by Xiaomi, Baidu. These boosted FXI ETF performance post-earnings. Guidance points to modest growth ahead.
Bullish Case
China stimulus fuels revenue for banks like China Construction Bank. Tech demand lifts Alibaba, Tencent.
Operational gains in EVs from BYD add edge. Market recovery drives steady expansion without overheat.
Bearish Case
U.S.-China trade risks pressure exports. Competition hits margins in tech.
Regulatory scrutiny on big firms slows growth. Economic slowdown could spur customer churn.
Market Sentiment & Investor Psychology
Short interest data limited for ETFs. Options show balanced calls and puts. Institutional ownership high at billions in AUM.
Retail flows steady into China bets. Sentiment tilts neutral to optimistic on stimulus news.
Short-Term Outlook
Technicals show oversold RSI bounce potential. Volume supports mild uptrend. Watch resistance at $39.24 for breakout clues. Expect sideways action with volatility.
Medium to Long-Term Outlook
Strong holdings in tech and finance bolster model. China growth outpaces developed markets. Competitive moats in Tencent aid position.
Financial health solid; risks from geopolitics linger. Long-term investors should hold or accumulate on dips.
FAQ Section
Is FXI ETF a buy right now?
Neutral stance; value at current levels but watch trade news.
What is the FXI ETF price target?
Average $47.67, up to $60.34.
What are major risks for FXI ETF?
Geopolitics, regulation, slowing China economy.
FXI ETF forecast for 2026?
Modest gains if stimulus holds; volatile path.
Suggestions
- Compare with SOXS ETF (Hong Kong focus)
- See our ASHR ETF forecast
- Read our China sector valuation breakdown
Conclusion
Hold FXI ETF for now. Valuation appeals, but risks balance rewards. Track China policy shifts.
Disclaimer: This article is for informational purposes only and not financial advice.