Explore NVD ETF price, technical analysis, forecast, and if NVD ETF is a buy. Get insights on GraniteShares 2x Short NVDA Daily ETF performance and risks as of March 2026.
Introduction
The NVD ETF tracks -2x the daily performance of NVIDIA stock. [finance] It aims to profit when NVDA falls.
Investors eye NVD ETF now amid NVDA’s AI-driven rally. Tech volatility draws short-term traders to this leveraged inverse fund.
Broader market conditions hit tech ETFs hard. Rising rates and NVDA competition affect daily resets in NVD ETF.
Latest NVD ETF Price & Trend
NVD ETF closed at $7.53 on February 27, 2026, up 8.50% that day from $6.94. [finance] Volume hit 105 million shares, far above the 48.8 million average.
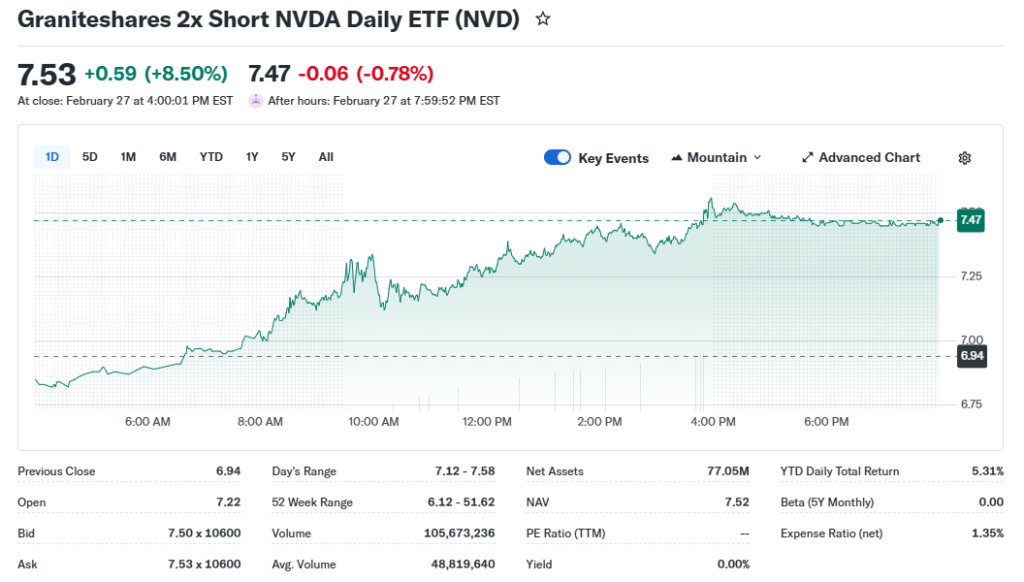
Over one month, NVD ETF gained as NVDA dipped, but exact figures show volatility from daily leverage. The 3-month trend rose sharply from summer 2025 lows around $12-13, reflecting NVDA pullbacks.
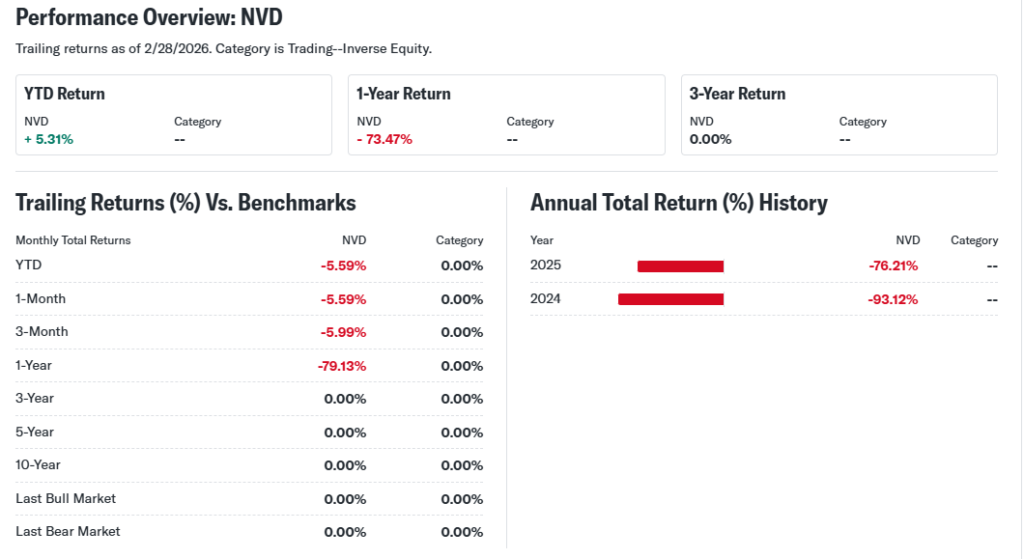
Year-to-date in 2026, NVD ETF surged from early-year levels near $30 in late 2025, down to recent lows. [finance] The 52-week range spans $6.12 low to $51.62 high. [finance] This bearish trend for NVDA signals bullish momentum for NVD ETF holders, but decay warns long-term investors.
Technical Analysis
Support levels sit near $6.12, the 52-week low, where buyers may step in. [finance] Resistance looms at $9-10, past recent highs.
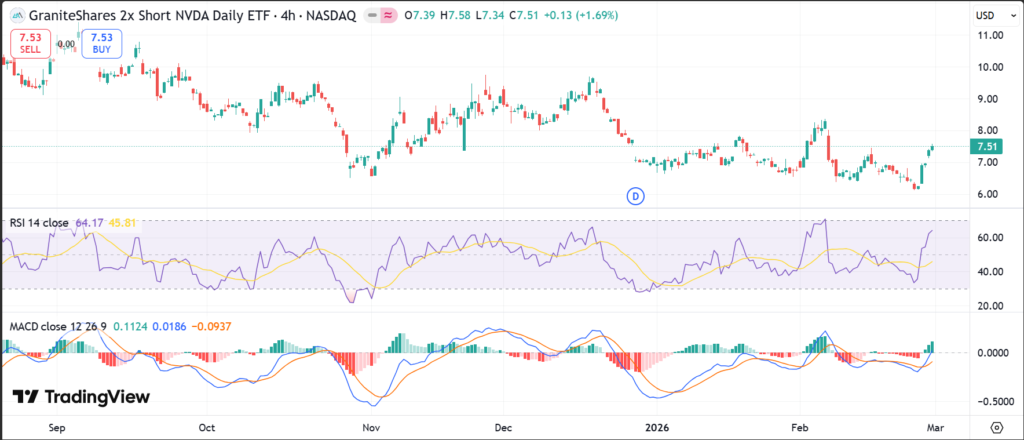
RSI reading hovers neutral around 40-50; below 30 signals oversold, above 70 overbought—key for momentum shifts. MACD shows sell signals currently, with bearish crossover for NVDA implying bullish for NVD ETF.
The 50-day moving average trends above price lately, while 200-day lags; no golden cross (bullish MA crossover) yet. Trading volume spikes indicate strong interest during NVDA drops. [finance] These tools help beginners spot entry points in volatile leveraged ETFs like NVD ETF.
Analyst Ratings & Price Targets
Few traditional ratings exist for leveraged ETFs like NVD ETF. Wall Street focuses on NVDA, indirectly boosting NVD ETF sentiment on pullbacks. No major upgrades/downgrades noted recently.
Average price targets lack consensus due to daily reset nature. Analysts view it as a tactical tool, not long-term hold. This means short-term traders drive NVD ETF, not buy-and-hold investors.
Insider Activity
NVD ETF has no traditional insiders as it’s an ETF. GraniteShares managers oversee swaps tied to NVDA. No recent buying or selling reported in filings.
Trends show no large transactions. This neutrality implies no strong confidence signals from fund operators. Watch NVDA insider moves for indirect clues.
Valuation Analysis
Leveraged ETFs like NVD ETF lack standard P/E or EPS. Expense ratio stands at 1.50%, high for daily trading.
Assets under management hit $178 million recently, with 18.94 million shares out. Compare to peers like NVDS (1.5x short); NVD ETF’s -2x leverage amps volatility. It appears fairly valued as a tactical bet, not undervalued—daily decay erodes over time.
Recent Earnings & Catalysts
NVD ETF reports no earnings; performance ties to NVDA swaps. Latest flows show volume surges on NVDA dips.
No quarterly results or guidance apply. Catalysts include NVDA earnings misses or AI hype fades. NVDA guidance often lifts stock, hurting NVD ETF short-term.
Bullish Case
NVD ETF shines if NVDA corrects from highs. Market saturation in AI chips boosts inverse plays.
Operational leverage from swaps offers quick gains on down days. Demand grows in volatile tech amid rate hikes.
Bearish Case
Daily compounding decay hurts NVD ETF in sideways markets. NVDA’s strength crushes shorts long-term.
Competition from milder shorts like NVDS adds pressure. Regulatory scrutiny on leveraged ETFs poses risks. Economic booms favor NVDA over NVD ETF.
Market Sentiment & Investor Psychology
Short interest data limited for ETFs; focus on NVDA’s low shorts. Options show put buying on NVDA spikes, aiding NVD ETF indirectly.
Institutional ownership low at 11 holdings, mostly swaps. Retail chases momentum, neutral bias now. Sentiment leans optimistic for shorts if NVDA cools.
Short-Term Outlook
Technical sell signals persist, but volume uptrends suggest momentum. [finance] NVDA resistance could lift NVD ETF briefly.
Expect volatility; watch NVDA news for swings without firm predictions.
Medium to Long-Term Outlook (6–24 Months)
Business model suits day trades, not holds due to decay. NVDA’s AI dominance weakens NVD ETF over time.
Financial health solid via swaps, but leverage risks mount. Long-term investors should watch, not accumulate.
FAQ Section
Is NVD ETF a buy right now?
Maybe for short-term NVDA bets; high risk from leverage.
What is the price target for NVD ETF?
No consensus; tied to NVDA moves, 52-week high $51.62. [finance]
What are major risks for NVD ETF?
Decay, NVDA rallies, high fees.
NVD ETF forecast?
Volatile; bullish if NVDA falls.
Suggestions
Compare with SOXS ETF
See our NVDA stock forecast
Read our leveraged ETF valuation breakdown
Conclusion
Watchlist. NVD ETF suits tactical trades on NVDA dips, but decay and volatility limit appeal. Hold if shorting NVDA; avoid long-term.
Disclaimer: This article is for informational purposes only and not financial advice.